USDCAD
On H4 we can see the instrument testing another support level inside the descending channel; the pair has formed several reversal candlesticks including a Hammer. We are looking at the start of the signal for reverse patterns realizing. We may suggest that a bounce off the current level may lead to 1.3190. However, another scenario is not impossible: the signal for reversal may not be realized, and a mall sideways movement may be followed by a breakthrough of the support and a drop to 1.3000.


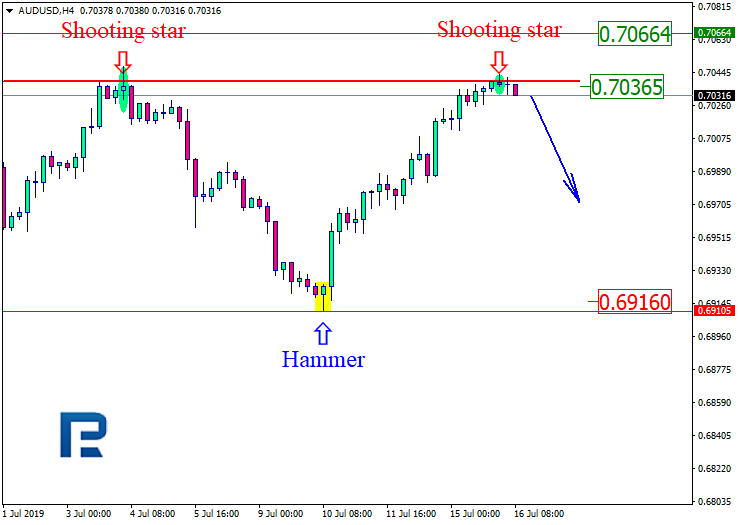
AUDUSD
On H4 the instrument is testing the resistance line, forming a Shooting star. In relation with the previous movements, we may suppose that the price may bounce off this level again and starts declining, aiming at 0.6916. At the same time a reverse variant should not be excluded: the price might break through the current resistance level and grow towards 0.7066.