AUDUSD: the pair has the potential to maintain its upward trajectory
Despite falling retail sales in Australia, the AUDUSD forecast is somewhat optimistic. More details in our analysis for 31 October 2024.
AUDUSD forecast: key trading points
- Australia’s retail sales (m/m): previously at 0.7%, currently at 0.1%
- US initial jobless claims: previously at 227,000, projected at 229,000
- Chicago PMI (US): previously at 46.6, projected at 46.9
- AUDUSD forecast for 31 October 2024: 0.6655
Fundamental analysis
Retail sales represent a monthly measure of goods sales based on a sample of retailers across various categories and sizes in Australia. Fundamental analysis for 31 October 2024 shows that the actual reading has decreased to 0.1%, adding to the negative factors for the Australian dollar.
US initial jobless claims are projected to increase to 229,000, which could offset some of the Australian data and be positive for the Australian dollar.
The Purchasing Managers’ Index reflects a country’s production volume over the previous period. Readings above 50.0 indicate economic growth, while those below 50.0 point to a downturn.
The projected PMI may reach 46.9 points, showing a slight increase, but there is potential for the Australian dollar to strengthen. If the actual PMI is below the previous reading, this could bolster confidence in the AUD.
AUDUSD technical analysis
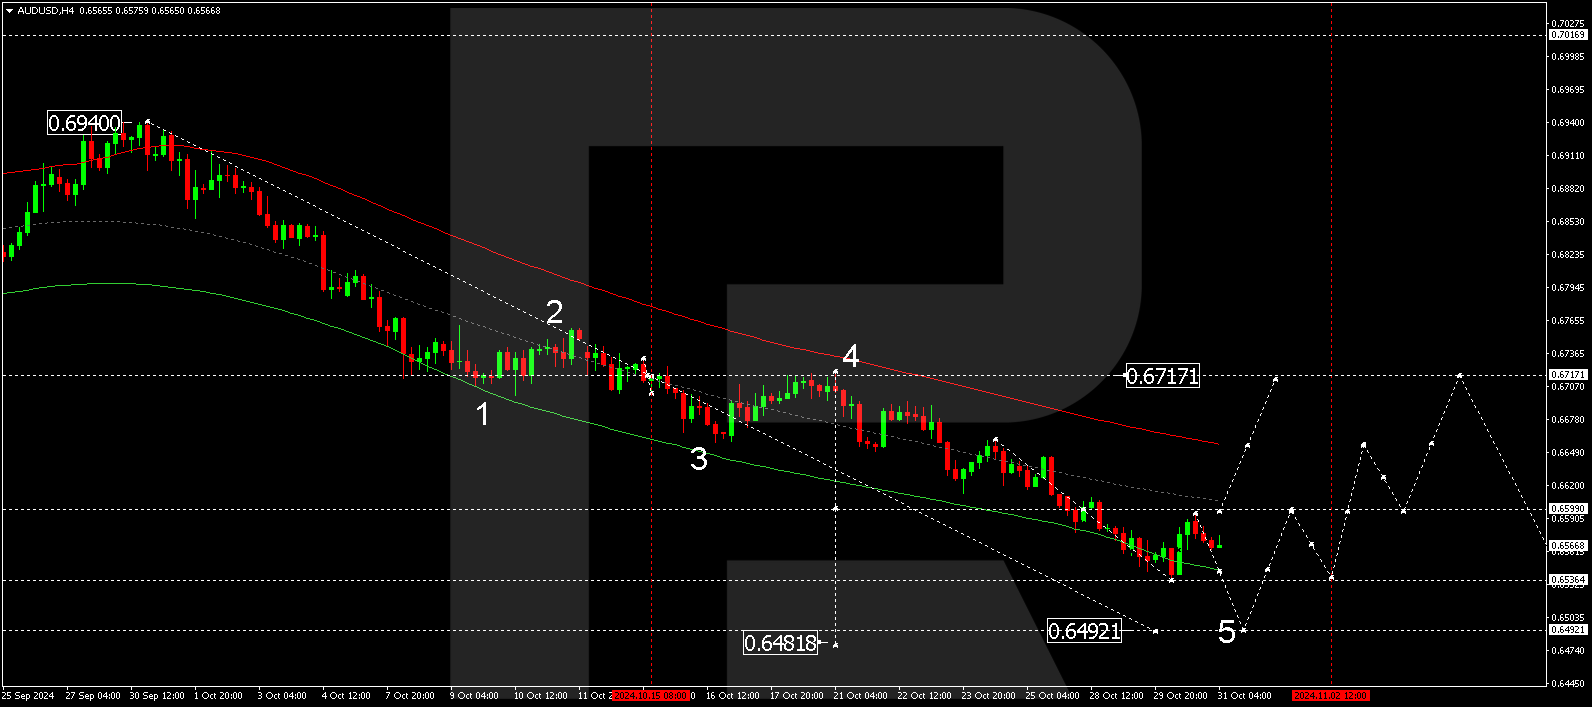
The AUDUSD H4 chart shows that the market has risen to 0.6595 and declined to 0.6563, practically outlining the boundaries of a consolidation range, expected to develop further today, 31 October 2024. Breaking above the range can be viewed as a continuation of a corrective wave towards 0.6655, with the trend potentially developing to 0.6717 (testing from below). In the event of a downward breakout, a trend movement could continue towards 0.6492.
The Elliott Wave structure and wave matrix for AUDUSD, with a pivot point at 0.6717, technically confirm this scenario. The market has reached the local target of a downward wave. A potential correction towards the upper boundary of the price envelope should be considered. A breakout above the 0.6590 level would open the potential for a wave towards 0.6655. Conversely, a breakout below 0.6555 would indicate that the correction is complete, potentially signalling a continued downward wave towards the envelope’s lower boundary.
Summary
Falling retail sales in Australia and an increase in US initial jobless claims offset each other. Still, together with technical analysis for today’s AUDUSD forecast, they suggest that a correction could continue towards 0.6655.

