Daily technical analysis and forecast for 3 July 2025
Here is a detailed daily technical analysis and forecast for EURUSD, USDJPY, GBPUSD, AUDUSD, USDCAD, XAUUSD and Brent for 3 July 2025.
EURUSD forecast
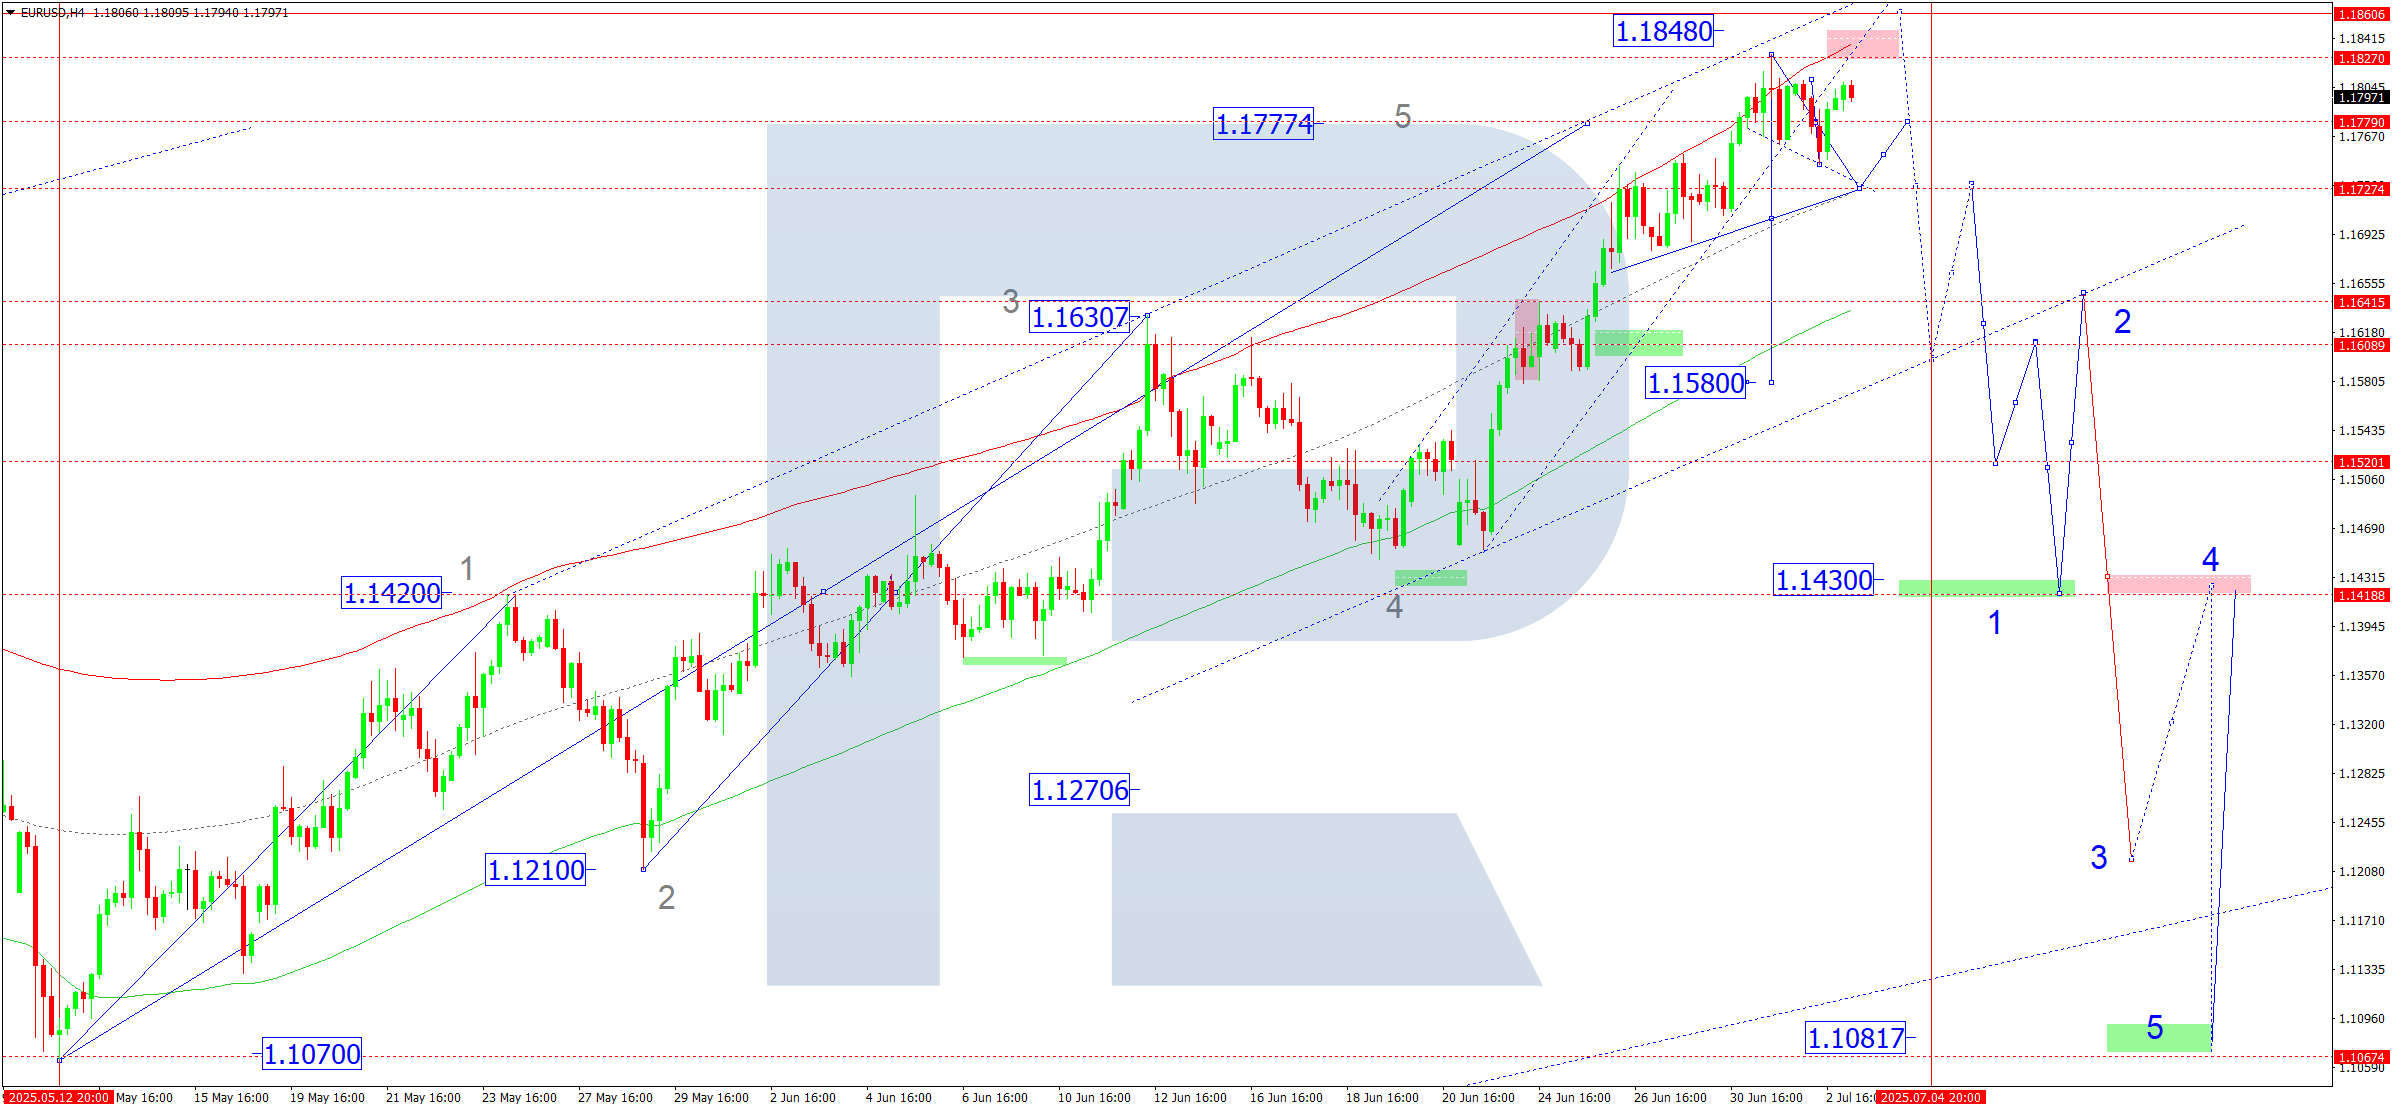
On the H4 chart of EURUSD, the market continues developing a consolidation range around 1.1777. Currently, the range has expanded down to 1.1746 and up to 1.1809. Today, 3 July 2025, we consider the possibility of a decline to 1.1727, followed by a rise to 1.1777. If the market breaks upwards out of this range, another growth wave towards 1.1848 is possible. A break downwards would open potential for a wave towards 1.1580.
Technically, this scenario is confirmed by the Elliott wave structure and the growth wave matrix with a rotation centre at 1.1430. This remains key within the wave structure for EURUSD. At the moment, the market has completed a growth wave towards the Price Envelope’s upper boundary at 1.1827. Today, a decline towards its central line at 1.1727 is expected.
Technical indicators for today’s EURUSD forecast suggest considering a downward wave towards 1.1727.
USDJPY forecast
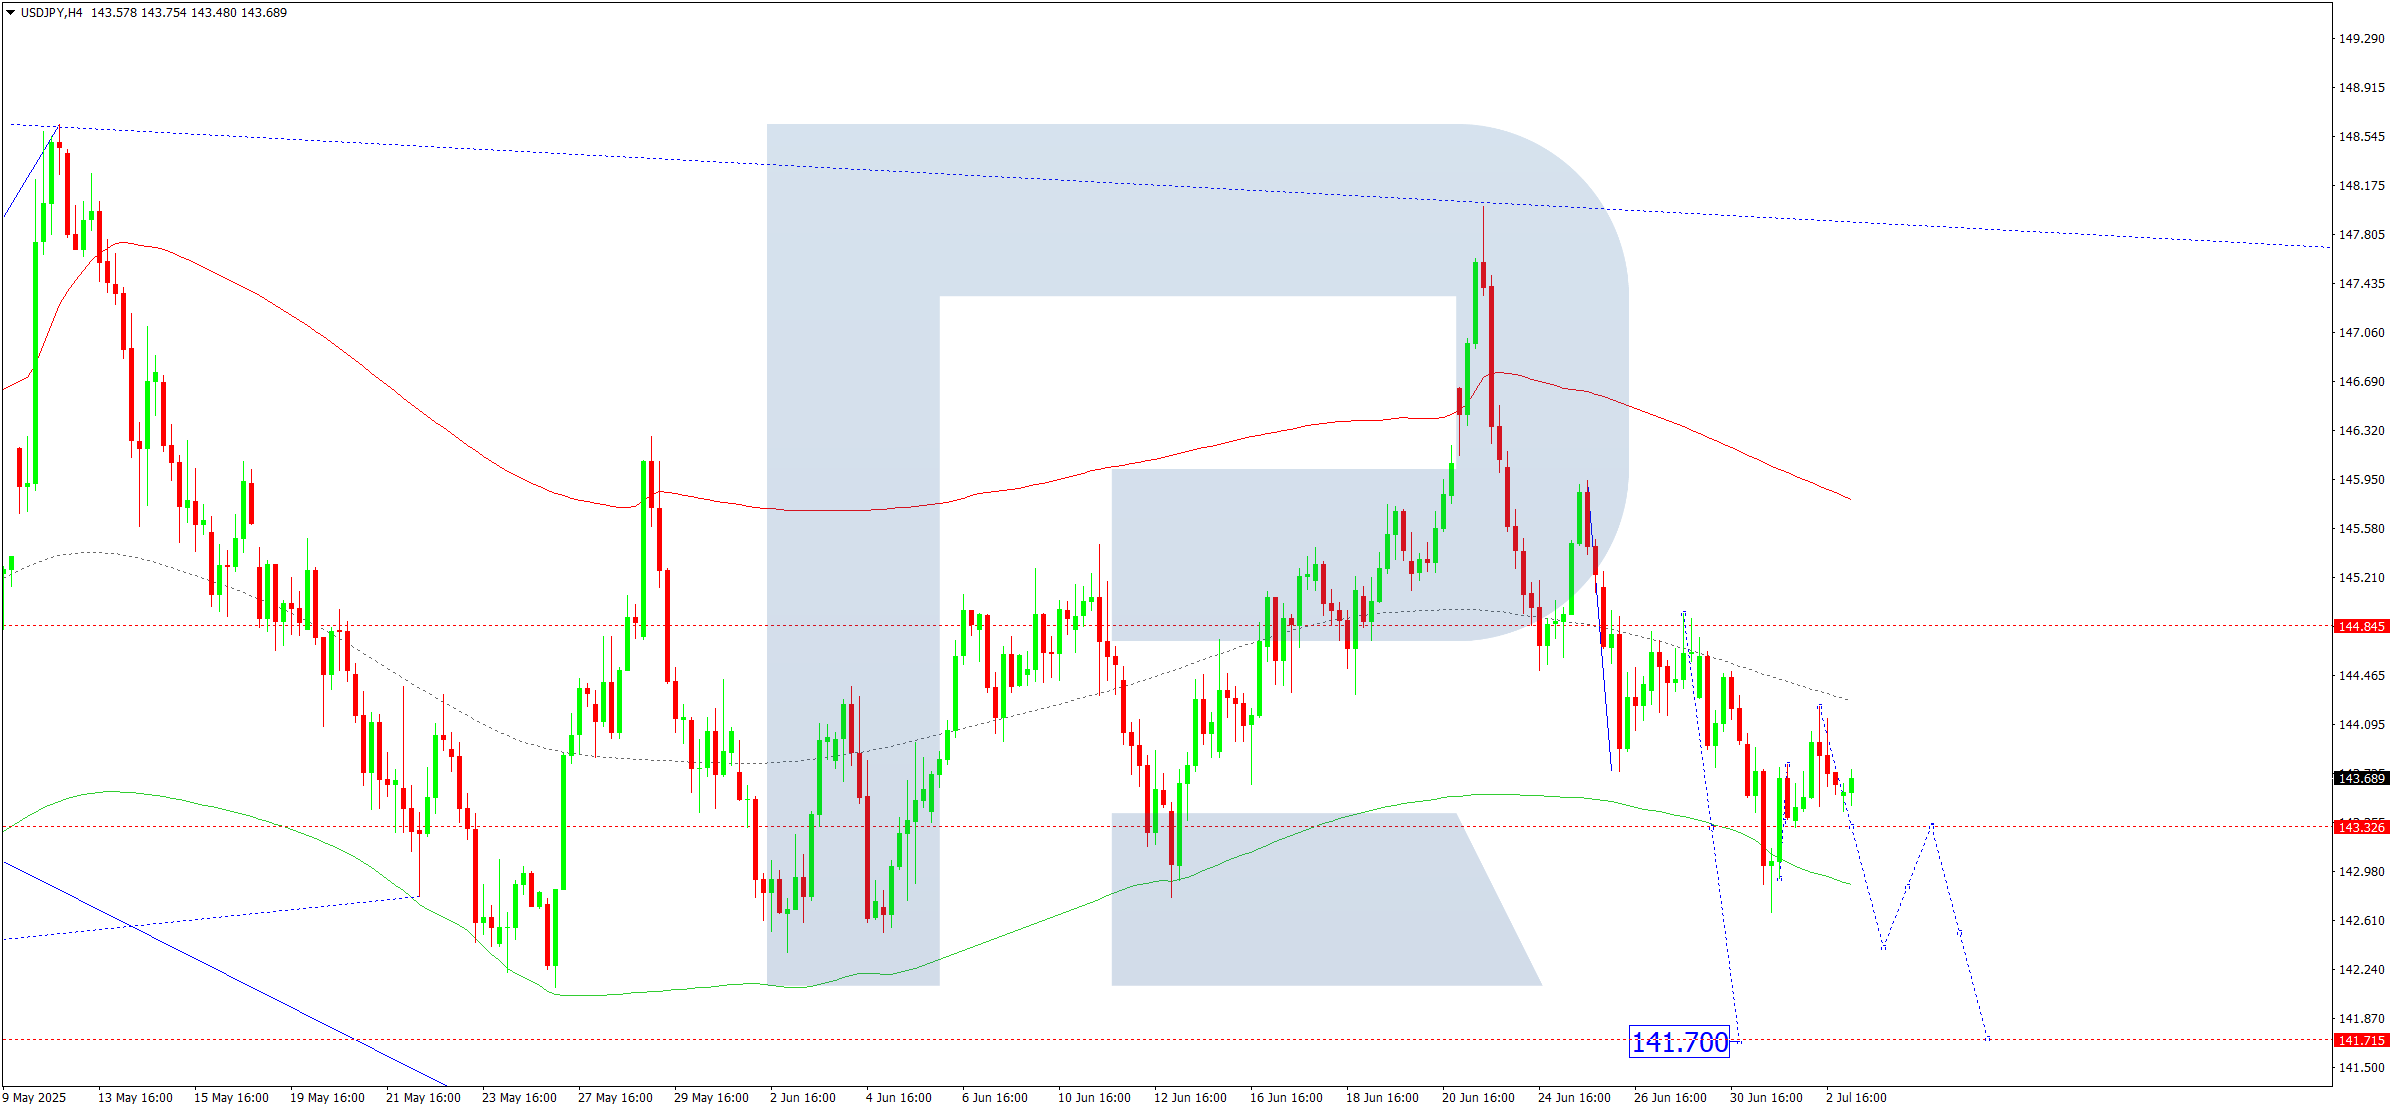
On the H4 chart of USDJPY, the market completed a growth wave to 144.23. Today, 3 July 2025, we will consider the possibility of a decline to 143.33. Breaking this level would open potential for a further downward wave towards 141.70. Afterwards, a corrective move back to 143.33 (testing from below) is possible.
Technically, this scenario for USDJPY is confirmed by the Elliott wave structure and the downward wave matrix with a rotation centre at 144.84. This remains key within this wave structure. Currently, the market is forming the fifth wave of decline. The market has completed half of this wave and corrected to the Price Envelope’s central line at 144.23. Further decline to 142.70 is expected, with trend continuation towards its lower boundary at 141.70.
Technical indicators for today’s USDJPY forecast suggest considering continuation of the downward wave towards 141.70.
GBPUSD forecast
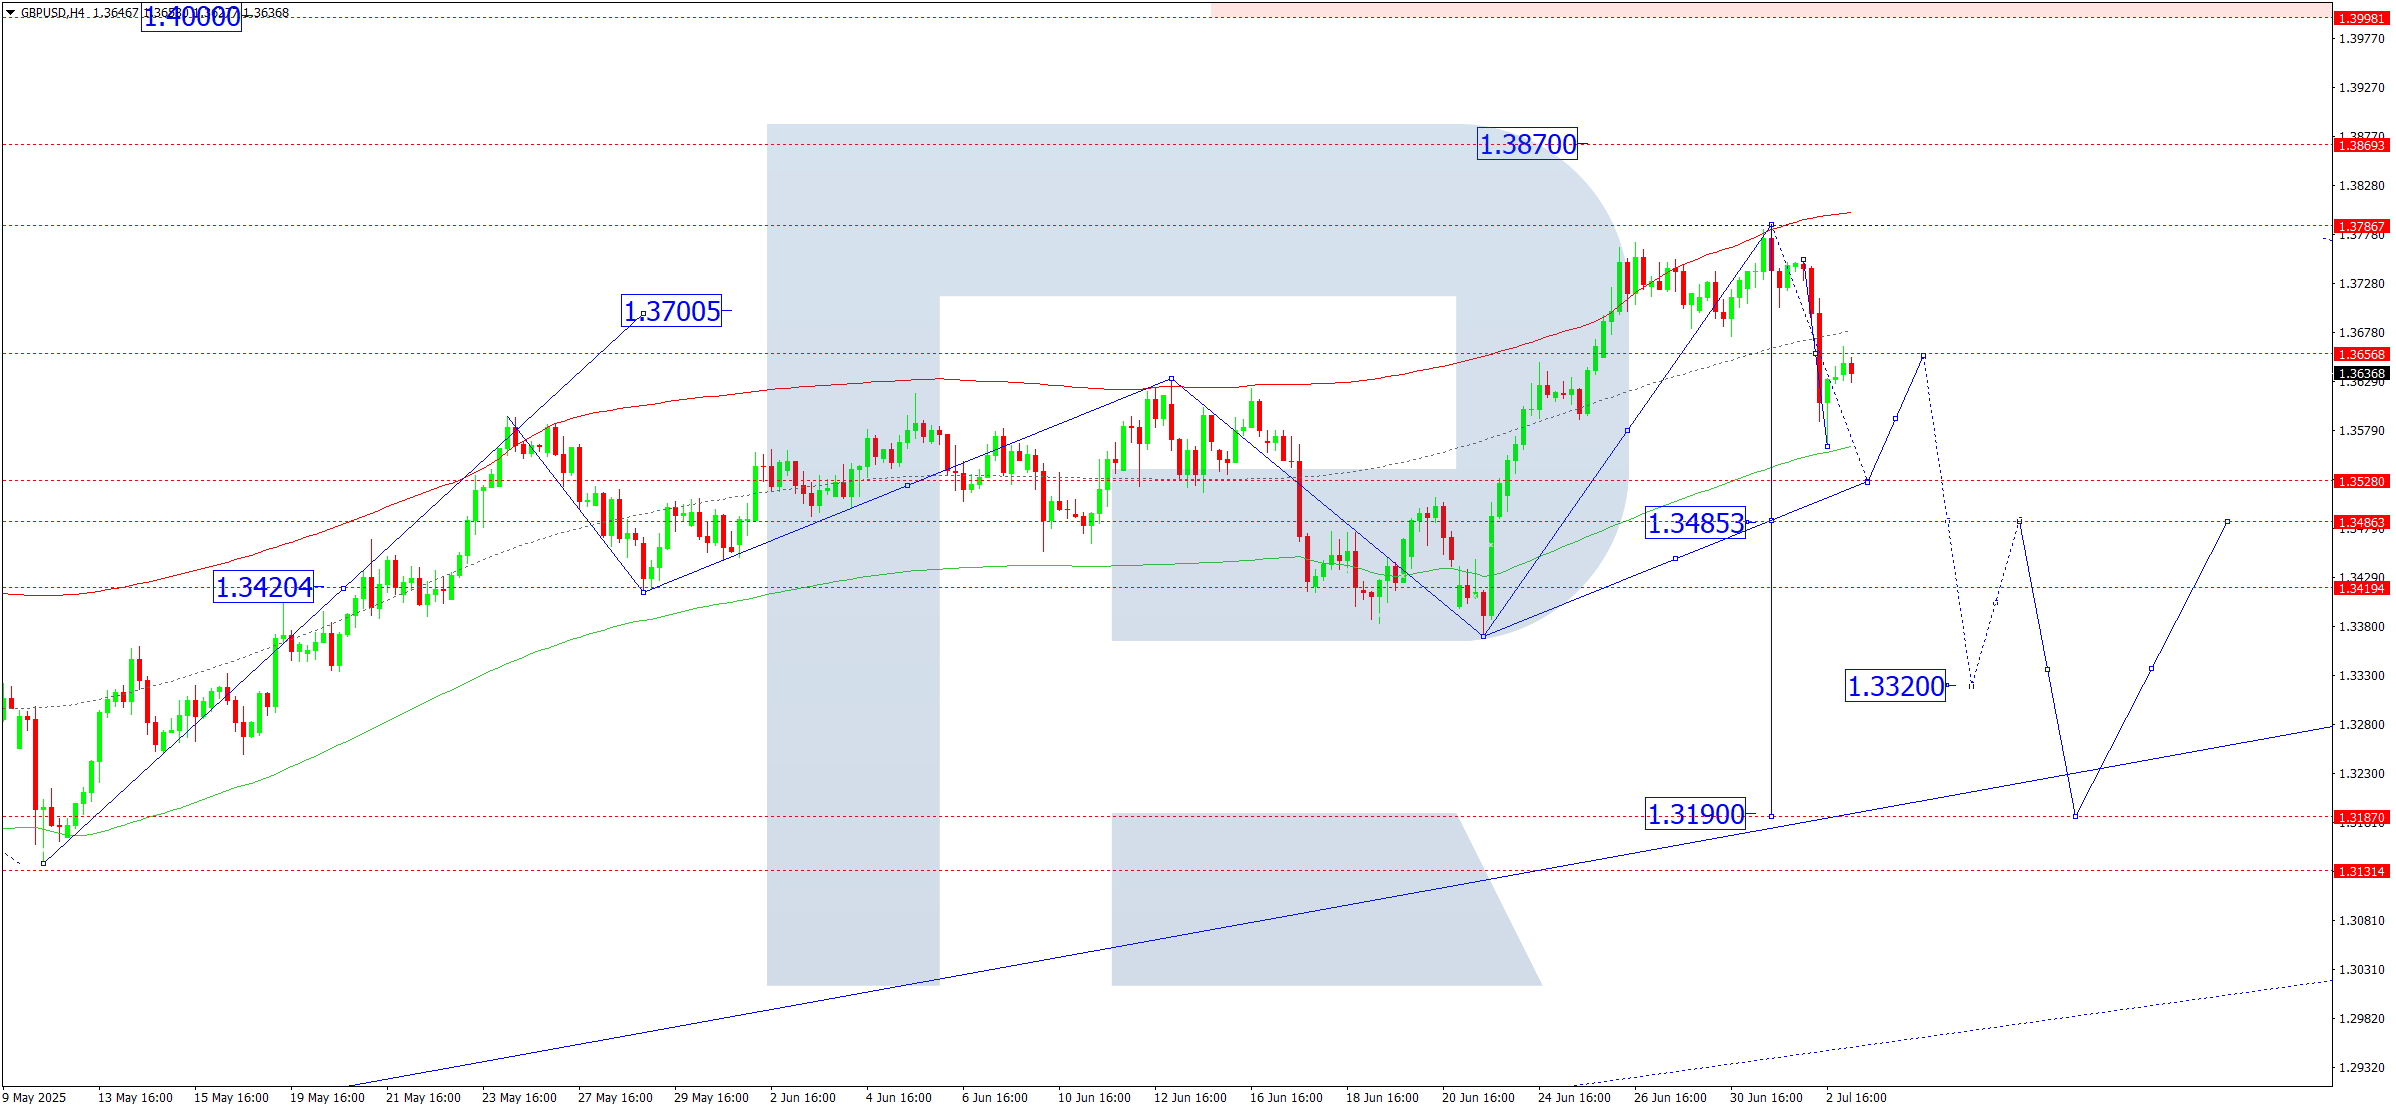
On the H4 chart of GBPUSD, the market completed a decline to 1.3562 and a correction to 1.3656. Today, 3 July 2025, we expect a decline to 1.3528. After reaching this level, a corrective move back to 1.3656 (testing from above) is possible. If the market breaks upwards out of this range, potential for a trend continuation towards 1.4000 opens. A break downwards would indicate continued correction towards 1.3320.
Technically, this scenario for GBPUSD is confirmed by the Elliott wave structure and the growth wave matrix with a rotation centre at 1.3400. This remains key within this wave structure. At the moment, the market has formed a consolidation range around the Price Envelope’s central line at 1.3656 and broke downwards towards its lower boundary at 1.3528. Today, it is relevant to consider reaching this target level and beginning a growth wave back to its central line at 1.3656.
Technical indicators for today’s GBPUSD forecast suggest considering growth towards 1.3528.
AUDUSD forecast
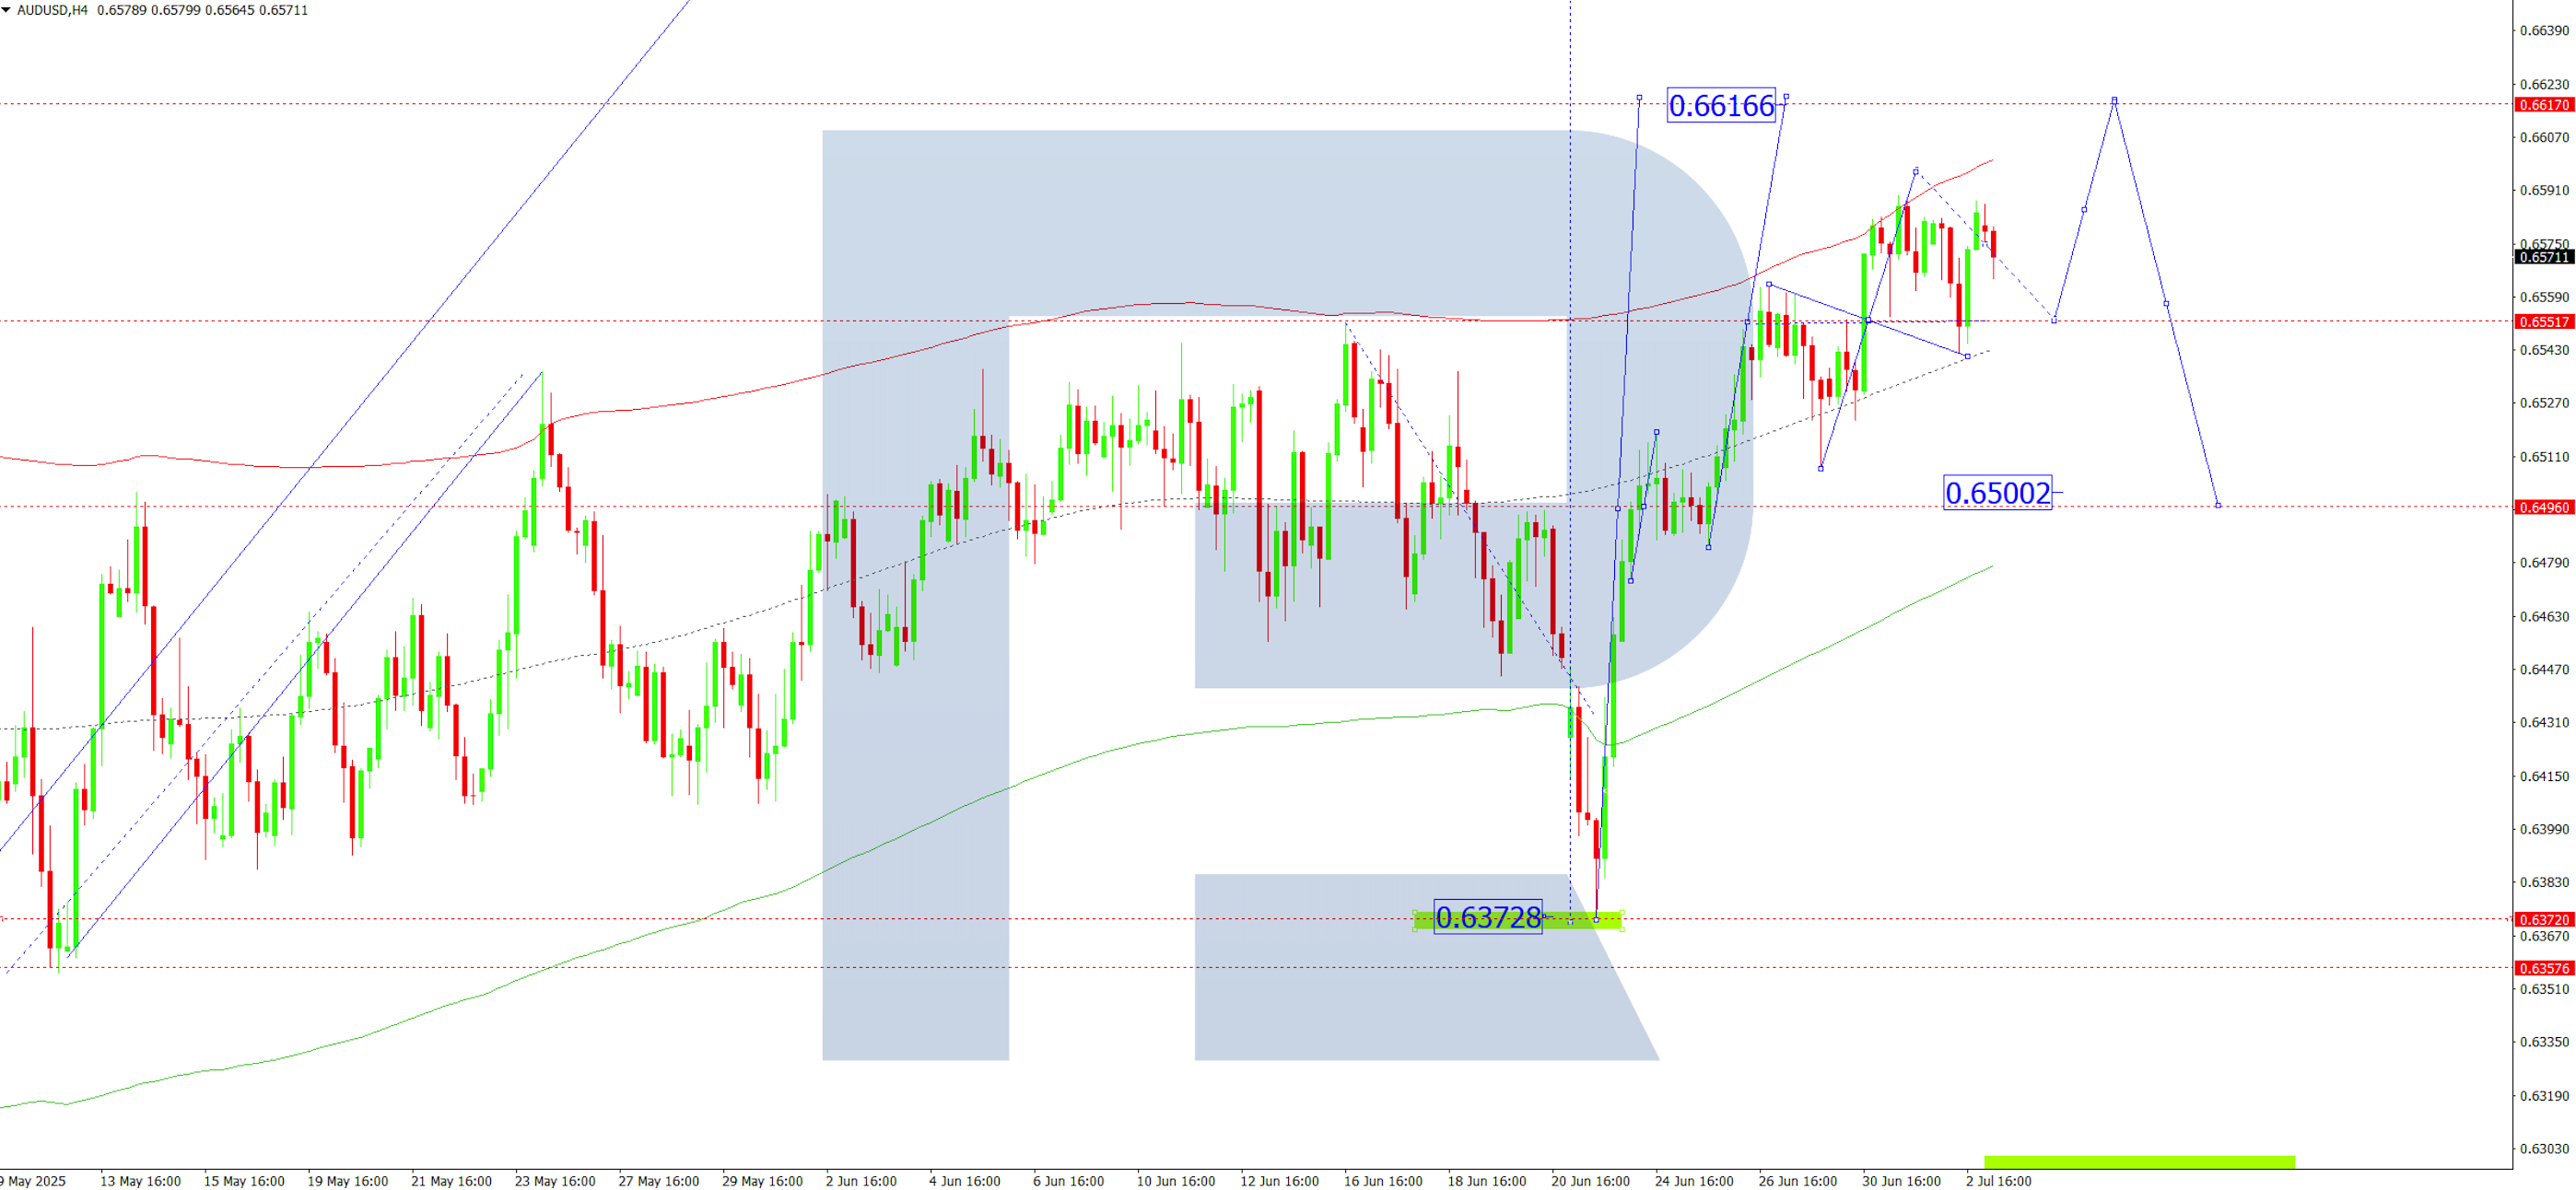
On the H4 chart of AUDUSD, the market continues developing a consolidation range around 0.6555. Today, 3 July 2025, a rise towards 0.6595 and a decline to 0.6535 are possible. If the market breaks upwards out of this range, continuation of the growth wave towards 0.6616 is relevant. Breaking downwards would open potential for a correction to 0.6500.
Technically, this scenario is confirmed by the Elliott wave structure and the growth wave matrix with a rotation centre at 0.6500. This remains key within this wave structure. At the moment, the market has broken above 0.6555 and continues its upward move towards the Price Envelope’s upper boundary at 0.6595. Afterwards, a correction back to its central line at 0.6555 is not excluded, followed by growth towards its upper boundary at 0.6616.
Technical indicators for today’s AUDUSD forecast suggest considering another growth wave towards 0.6595.
USDCAD forecast
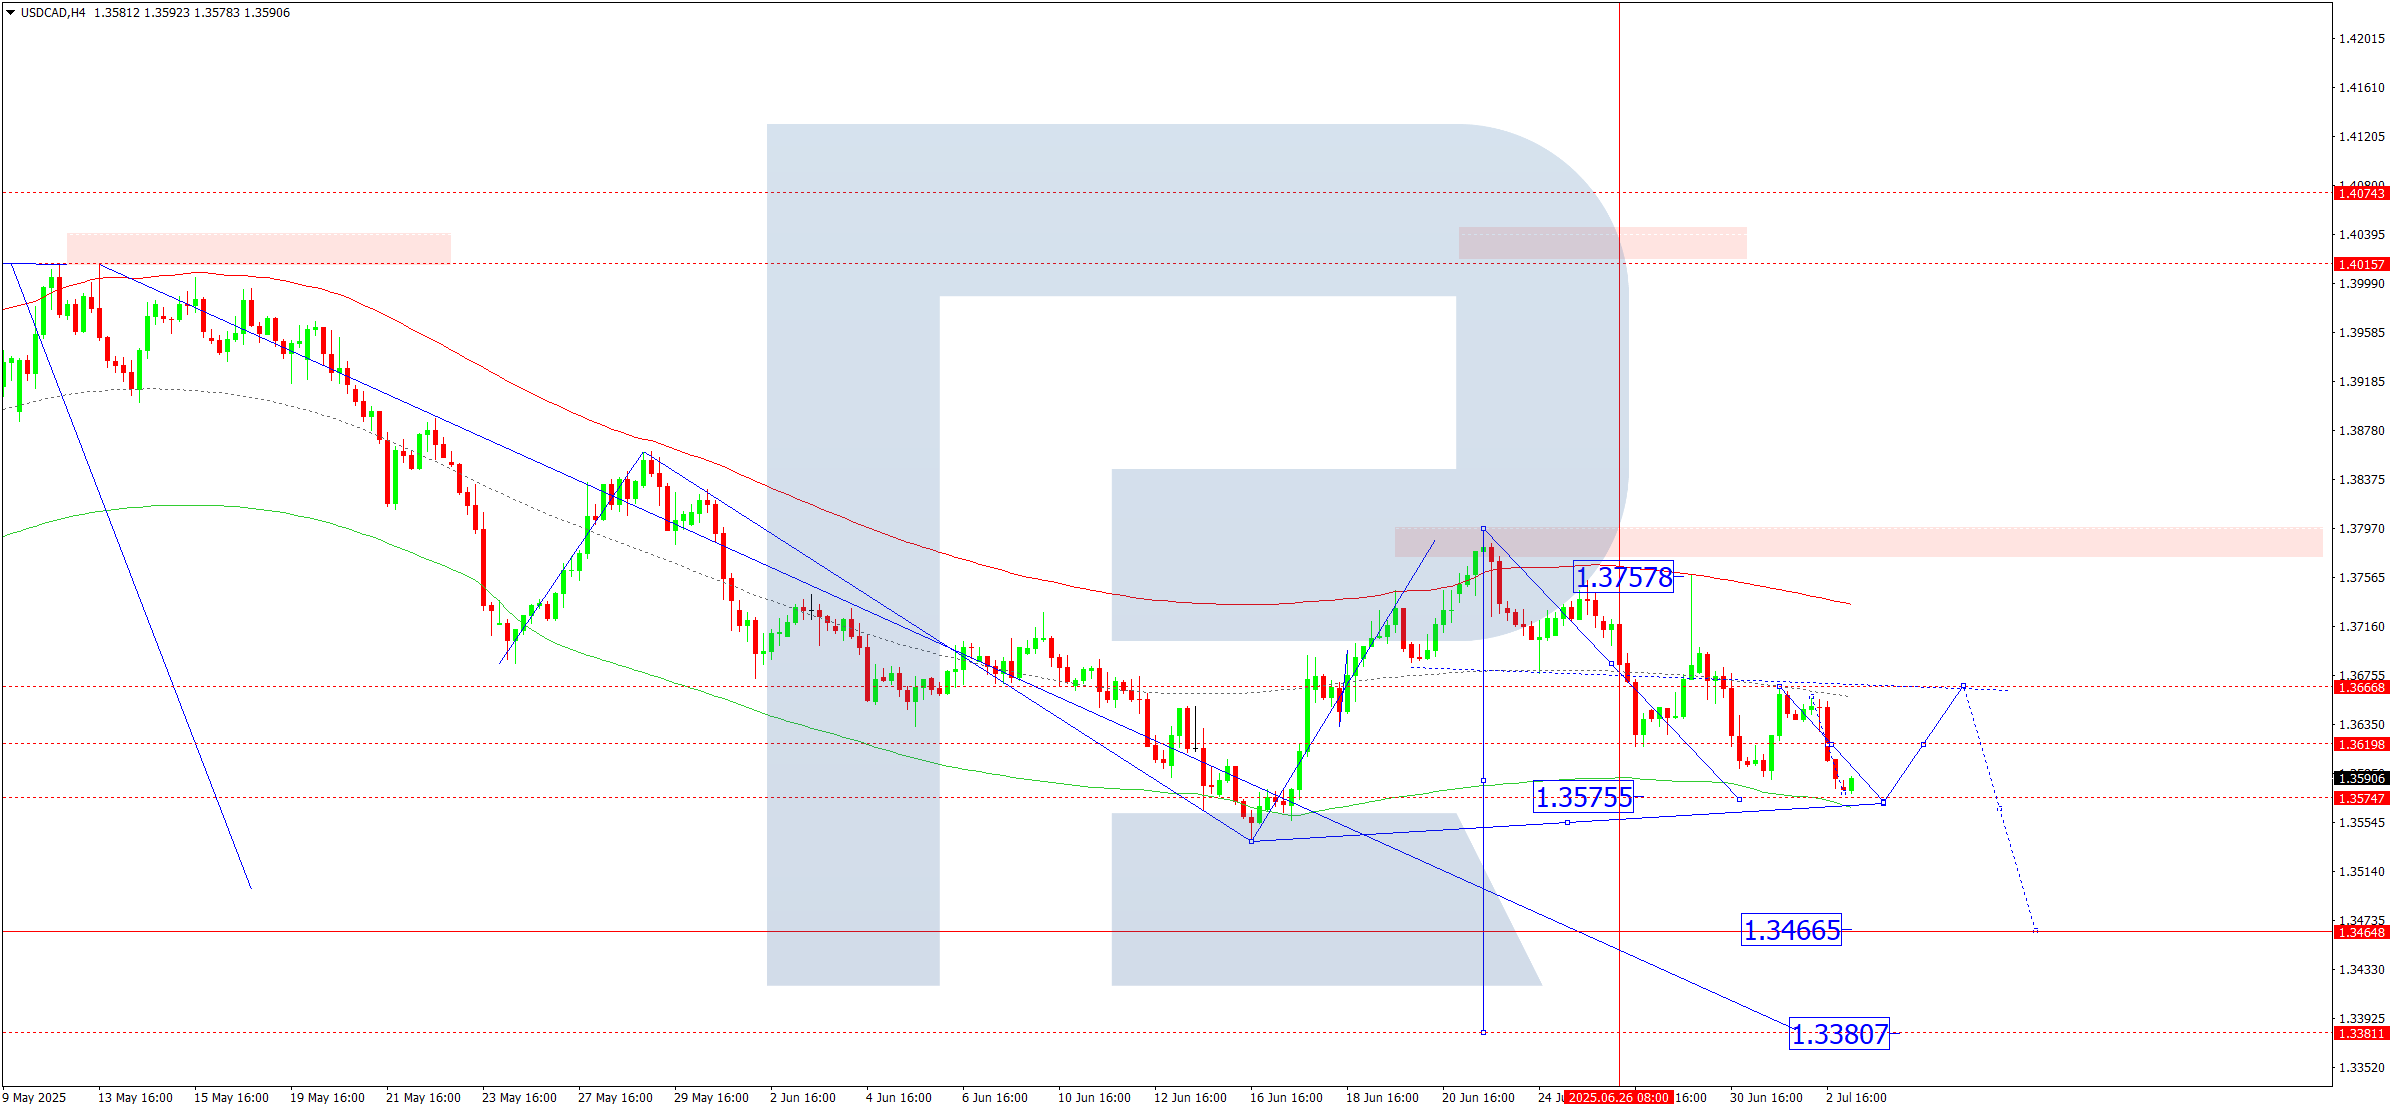
On the H4 chart of USDCAD, the market is forming a consolidation range around 1.3620. Today, 3 July 2025, we expect a decline to 1.3575. After reaching this level, a growth move back to 1.3666 (testing from below) is possible. Afterwards, another downward wave towards 1.3466 is anticipated, with trend continuation towards 1.3380.
Technically, this scenario is confirmed by the Elliott wave structure and the downward wave matrix with a rotation centre at 1.3666. This remains key within this wave structure for USDCAD. At the moment, the market continues its consolidation around the Price Envelope’s central line at 1.3666. Today, a decline to its lower boundary at 1.3575 is relevant, followed by growth back to its central line at 1.3666.
Technical indicators for today’s USDCAD forecast suggest considering decline towards 1.3575.
XAUUSD forecast
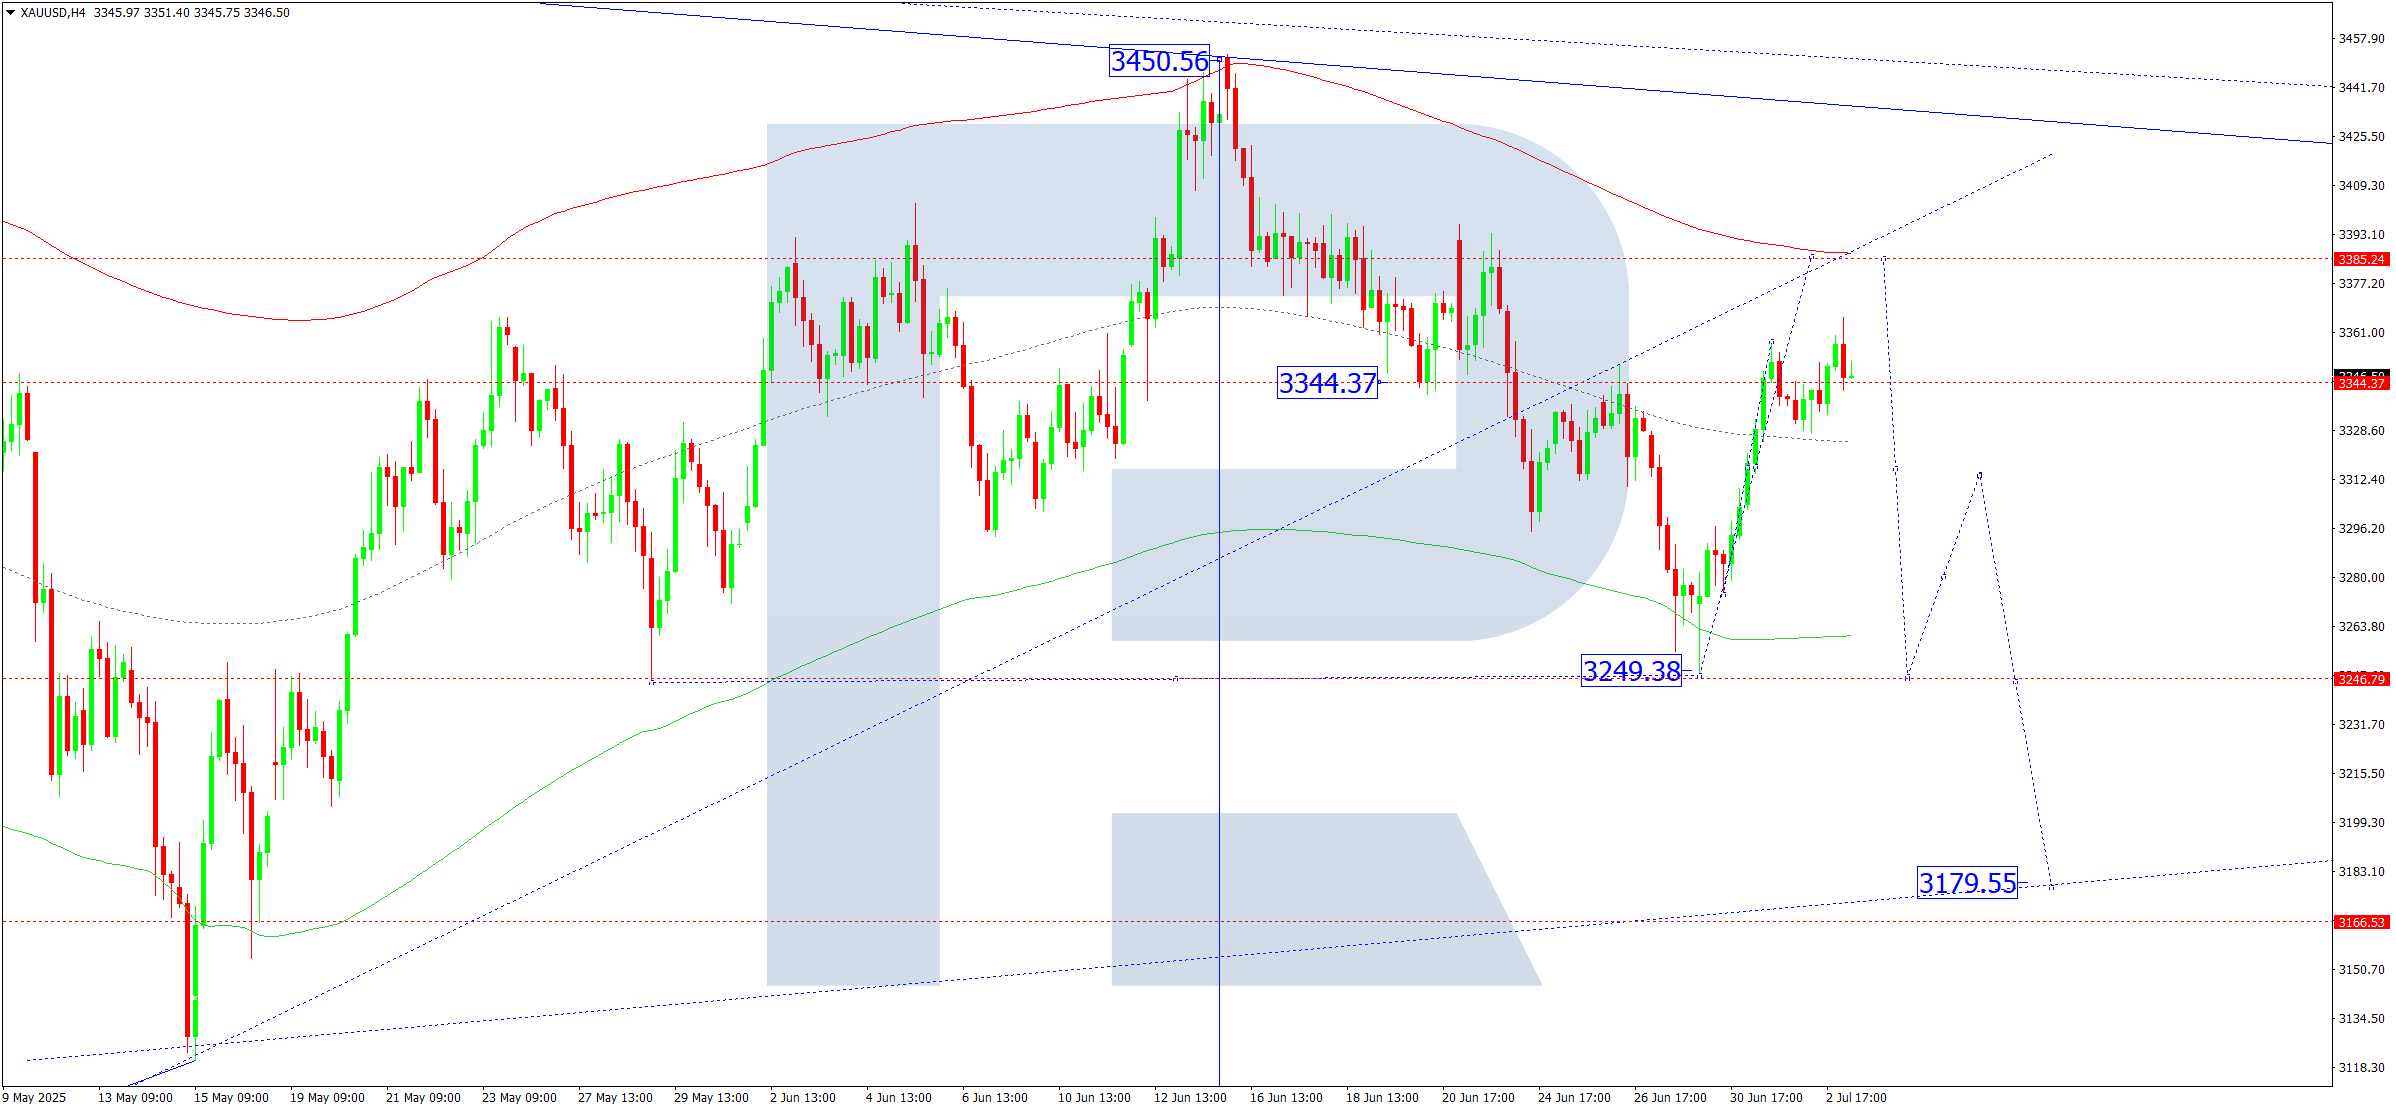
On the H4 chart of XAUUSD, the market is forming a consolidation range around 3344 without a clear trend. Today, 3 July 2025, if the market breaks upwards, a further correction to 3385 is possible. Afterwards, a downward wave towards 3250 is anticipated. A broad consolidation structure is forming around 3344.
Technically, this scenario is confirmed by the Elliott wave structure and the downward wave matrix with a rotation centre at 3344. This remains key within this wave structure. Currently, the market has completed a downward wave to the Price Envelope’s lower boundary at 3249 and a correction back to its central line at 3344. Today, growth towards its upper boundary at 3385 is relevant, followed by a decline towards its lower boundary at 3250.
Technical indicators for today’s XAUUSD forecast indicate a possible growth wave towards 3385 and a subsequent decline towards 3250.
Brent forecast
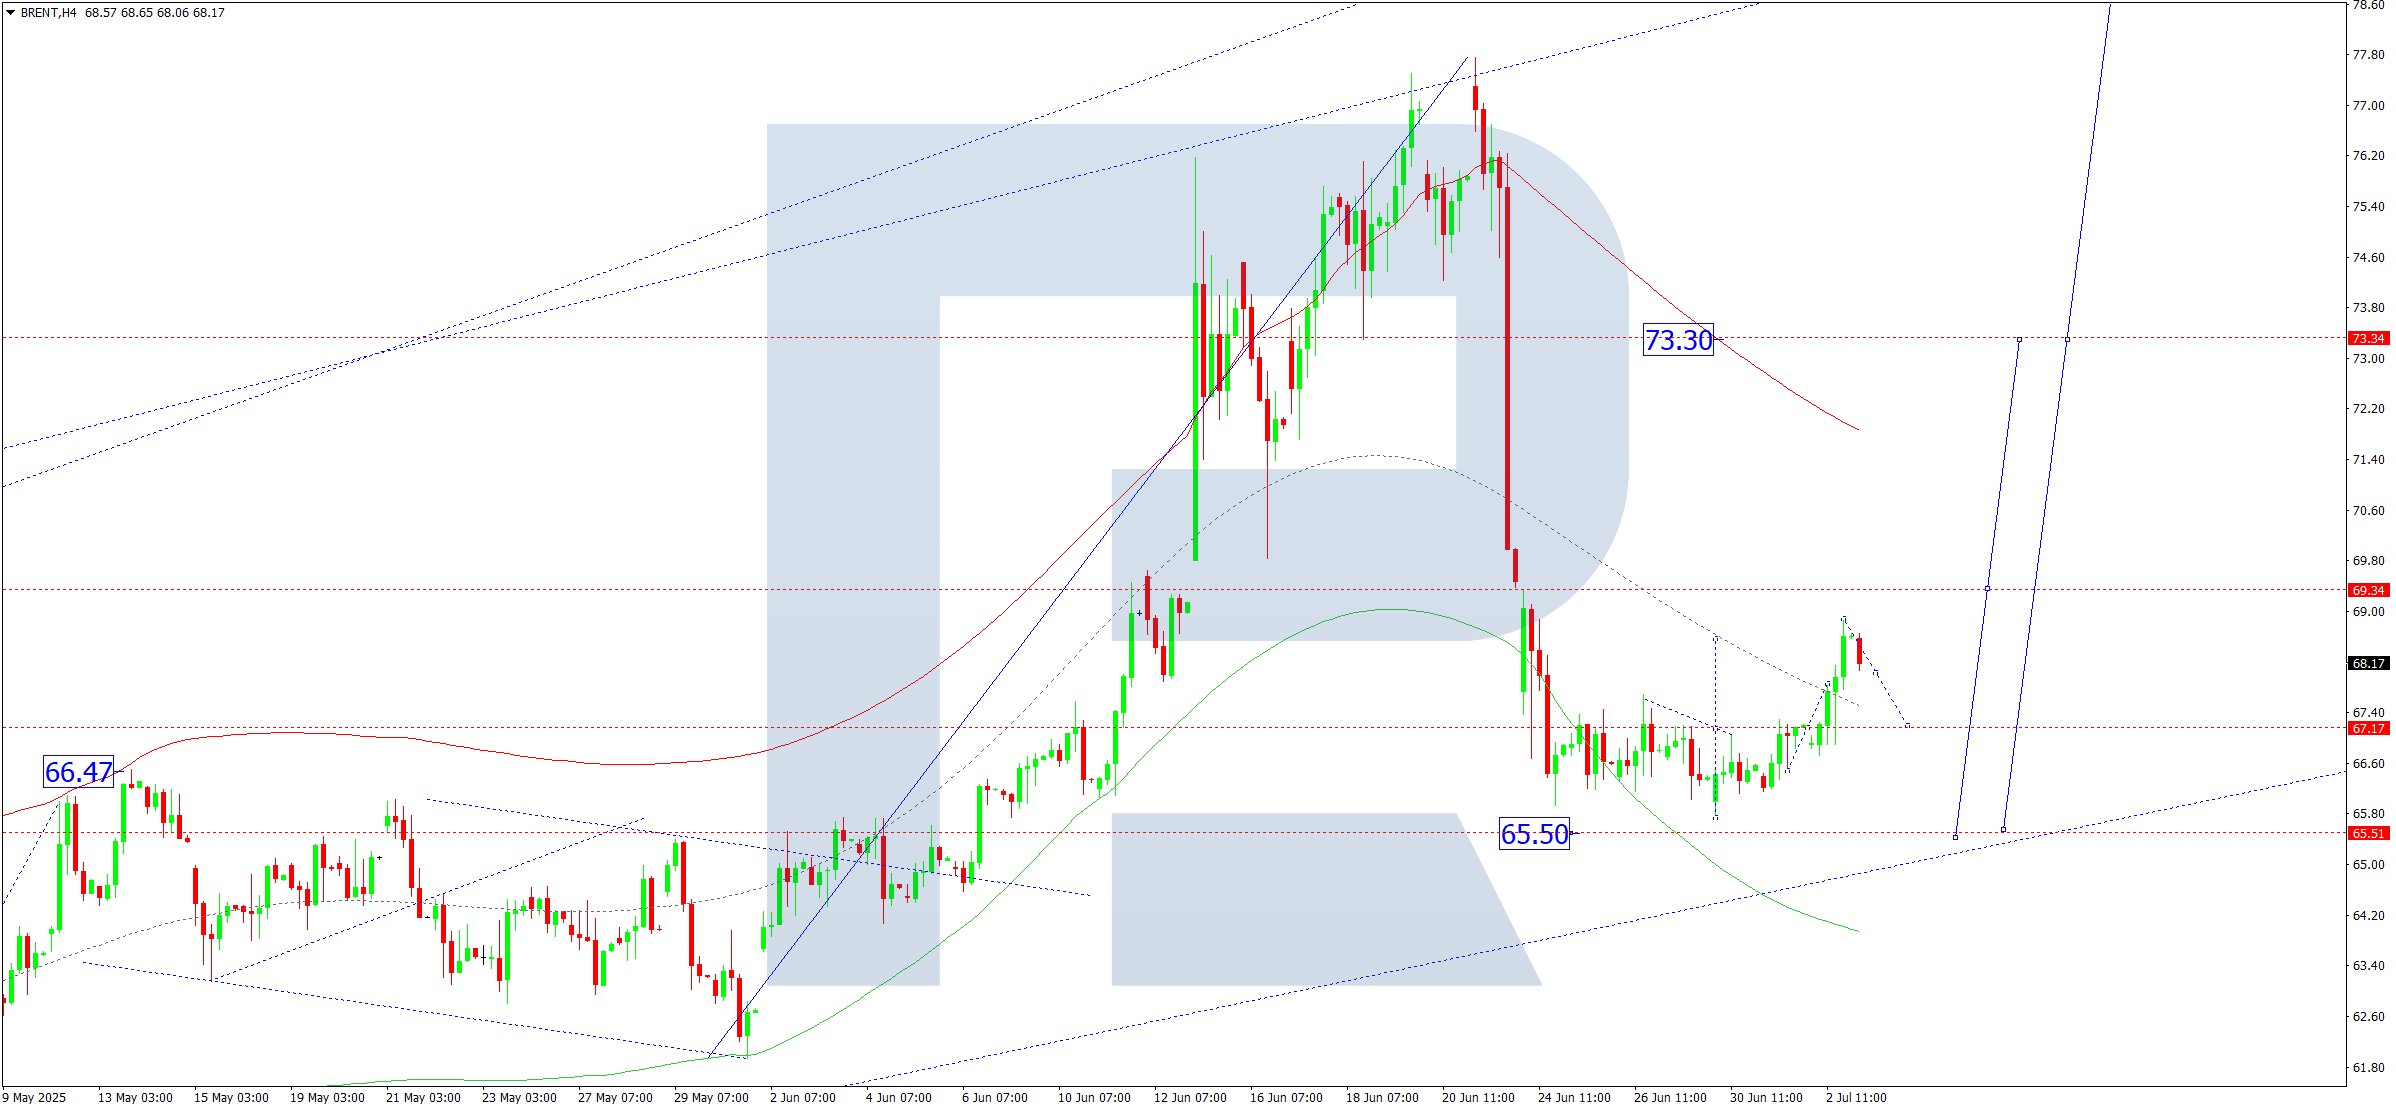
On the H4 chart of Brent crude, the market formed a consolidation range around 67.17 and broke upwards, completing a growth wave towards 68.92. Today, 3 July 2025, we expect a decline to 67.17 (testing from above). If the market breaks upwards out of this range, potential for a growth wave towards 73.30 opens. A break downwards would indicate continuation of the wave towards 65.50. Afterwards, growth towards 73.30 is anticipated.
Technically, this scenario is confirmed by the Elliott wave structure and the growth wave matrix with a rotation centre at 70.00. This remains key within Brent’s wave structure. Currently, the market is forming a consolidation range around the Price Envelope’s central line at 67.17. It is relevant to consider growth towards its upper boundary at 73.30.
Technical indicators suggest today’s Brent forecast considers a possible growth wave towards 73.30.
