EURUSD, USDJPY, GBPUSD, AUDUSD, USDCAD, XAUUSD, and Brent technical analysis and forecast for 18 December 2024
Here is a detailed daily technical analysis and forecast for EURUSD, USDJPY, GBPUSD, AUDUSD, USDCAD, XAUUSD, and Brent for 18 December 2024.
EURUSD forecast
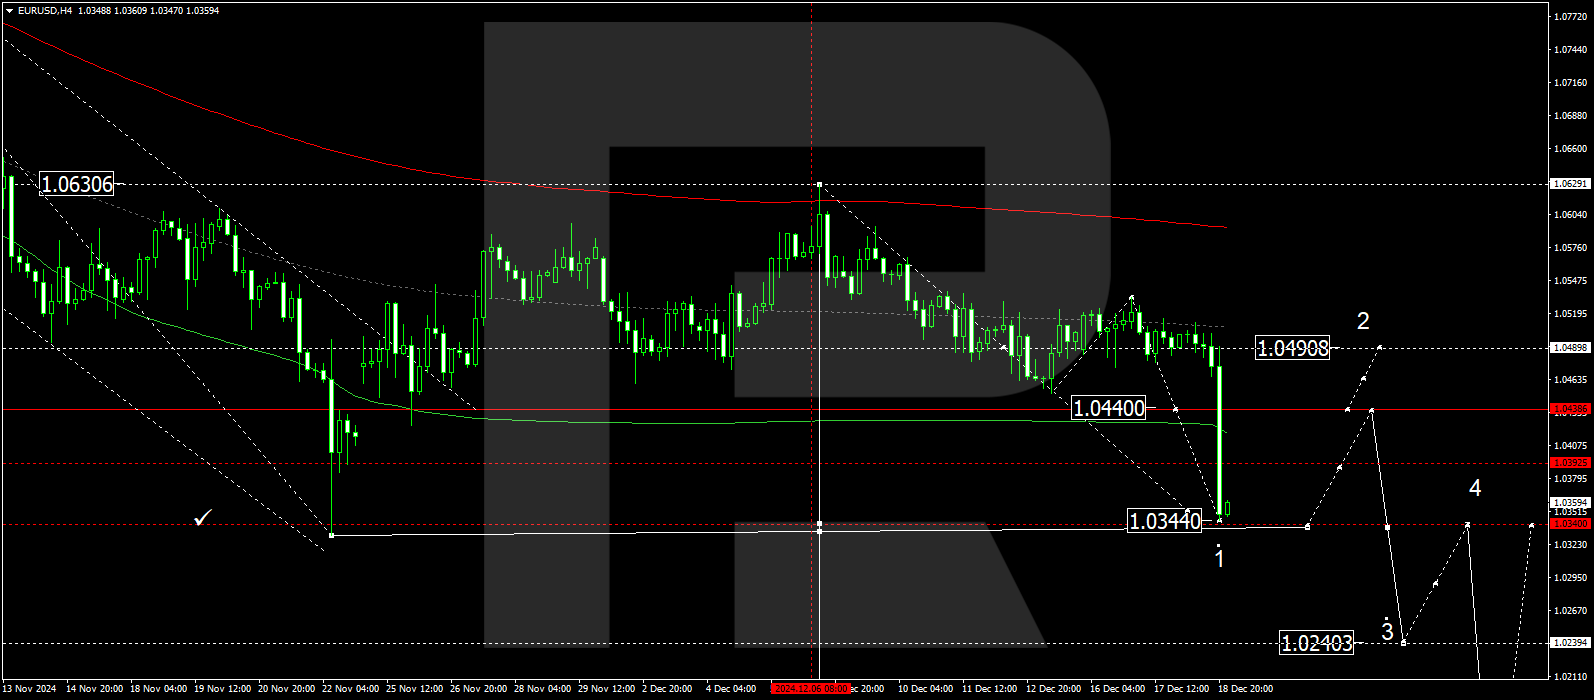
On the H4 chart, EURUSD rebounded from resistance at 1.0490, completing a downward wave structure targeting 1.0344. This marks the estimated target for the first wave of the decline. Today, 19 December 2024, a narrow consolidation range could form around 1.0360, with a possible extension down to 1.0338. If the price breaks upwards from the range, it may signal a corrective movement towards 1.0440. After the correction is complete, a new downward wave could begin, aiming for the local target of 1.0240.
Technically, this scenario is supported by the indicated Elliott wave structure and the matrix for the first wave of the decline, centred around 1.0490. This level is considered pivotal for EURUSD during this wave. Currently, the market has declined from the central line of the price envelope at 1.0533, achieving the calculated wave target of 1.0344. Further continuation of the decline towards the lower boundary of the envelope at 1.0338 is expected. Once this level is reached, a correction to 1.0440 is possible, with a potential extension to the upper boundary of the envelope at 1.0490.
Technical indicators for today’s EURUSD forecast suggest the potential for a rise to 1.0440.
USDJPY forecast
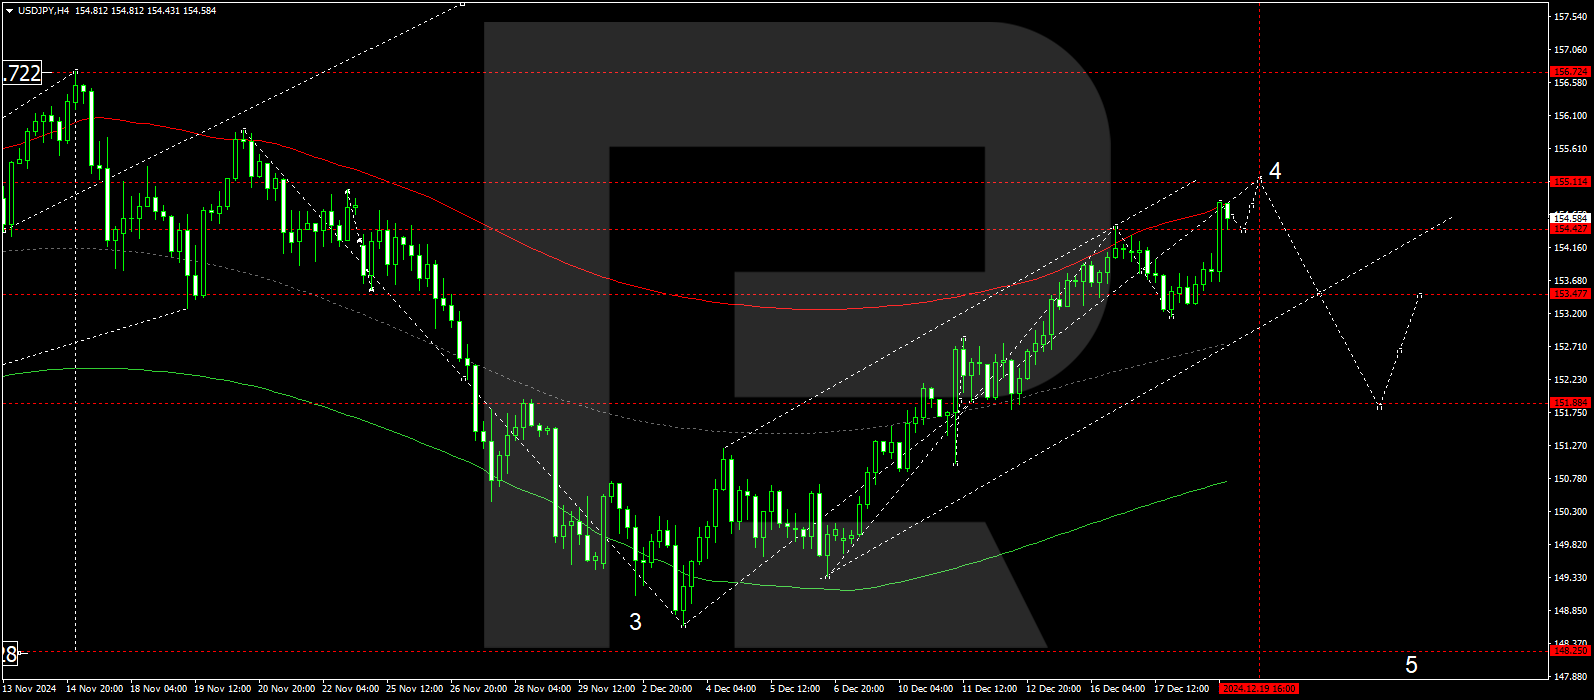
On the H4 chart, USDJPY received support at 153.15, breaking upwards through 154.40. Today, 19 December 2024, a technical pullback and test of 154.40 from above are anticipated. After that, a new wave of growth towards 155.15 is expected. Once this level is reached, a correction may follow to 153.53, the initial target.
Technically, this scenario for USDJPY is supported by the indicated Elliott wave structure and the growth wave matrix, centred at 152.00. The market is currently near the upper boundary of the price envelope at 154.88. In the short term, a decline to 154.40 is relevant, followed by further growth towards the upper boundary of the envelope, at 155.15. After reaching this target level, a wave of decline towards the central line of the envelope, at 153.53, is expected.
Technical indicators for today’s USDJPY forecast suggest the potential for a rise to 155.15.
GBPUSD forecast
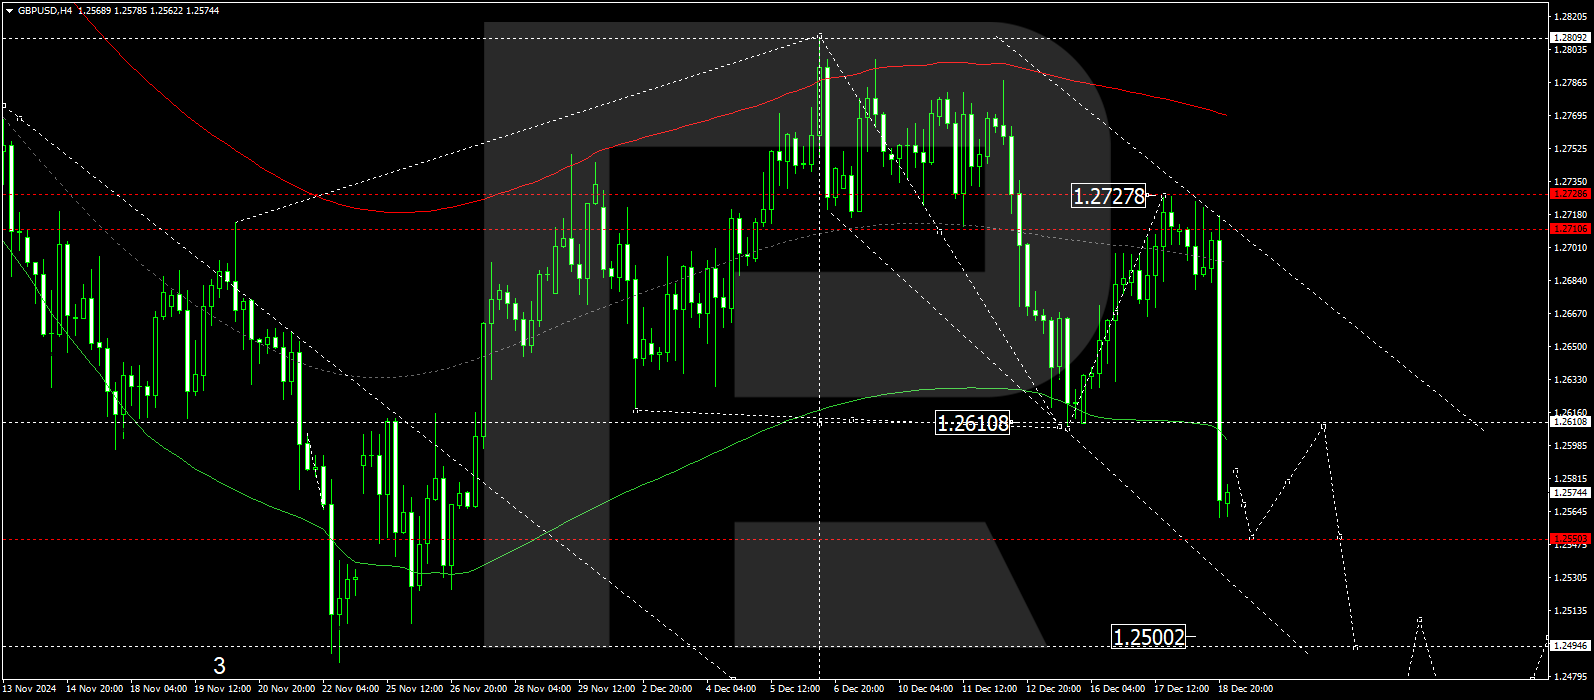
On the H4 chart, GBPUSD declined from resistance at 1.2717, breaking through 1.2611. The decline extended to 1.2562. Today, 19 December 2024, a consolidation range could form above this level, possibly extending the range downward to 1.2552. Subsequently, a corrective move to retest 1.2611 from below is expected, followed by a new wave of decline to 1.2500, the local target.
Technically, this scenario is supported by the indicated Elliott wave structure and the wave matrix centred at 1.2611. Currently, the market has declined from the central line of the price envelope at 1.2717, continuing towards 1.2552. The local target remains 1.2500, with further development of the decline structure towards the lower boundary of the price envelope.
Technical indicators for today’s GBPUSD forecast suggest the potential continuation of the decline to 1.2552.
AUDUSD forecast
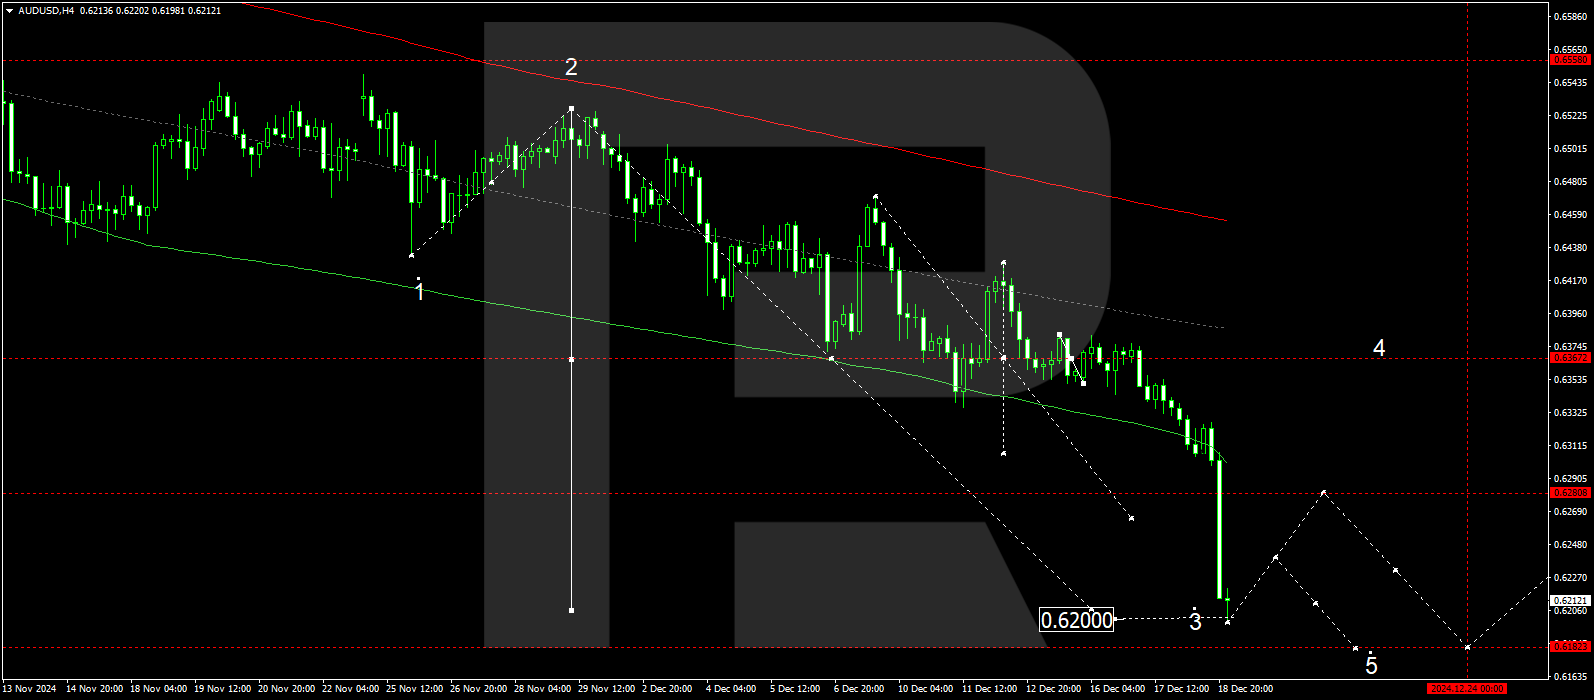
On the H4 chart, AUDUSD declined from resistance at 0.6366, breaking below 0.6333 and reaching a local wave target of 0.6200. Today, 19 December 2024, a consolidation range is expected to form above this level. A correction to 0.6280 (a retest from below) is likely if the range breaks upwards. After the correction, the next wave of decline is expected to extend towards the primary target of 0.6180.
Technically, this scenario is supported by the indicated Elliott wave structure and the matrix for the wave of decline, centred at 0.6366. The market has achieved the local target of 0.6200 and continues to shape the decline towards the lower boundary of the price envelope at 0.6180. Today, a correction towards the central line of the envelope at 0.6280 is possible, followed by a decline to the lower boundary of the envelope at 0.6180.
Technical indicators for today’s AUDUSD forecast suggest the potential for a correction to 0.6280.
USDCAD forecast
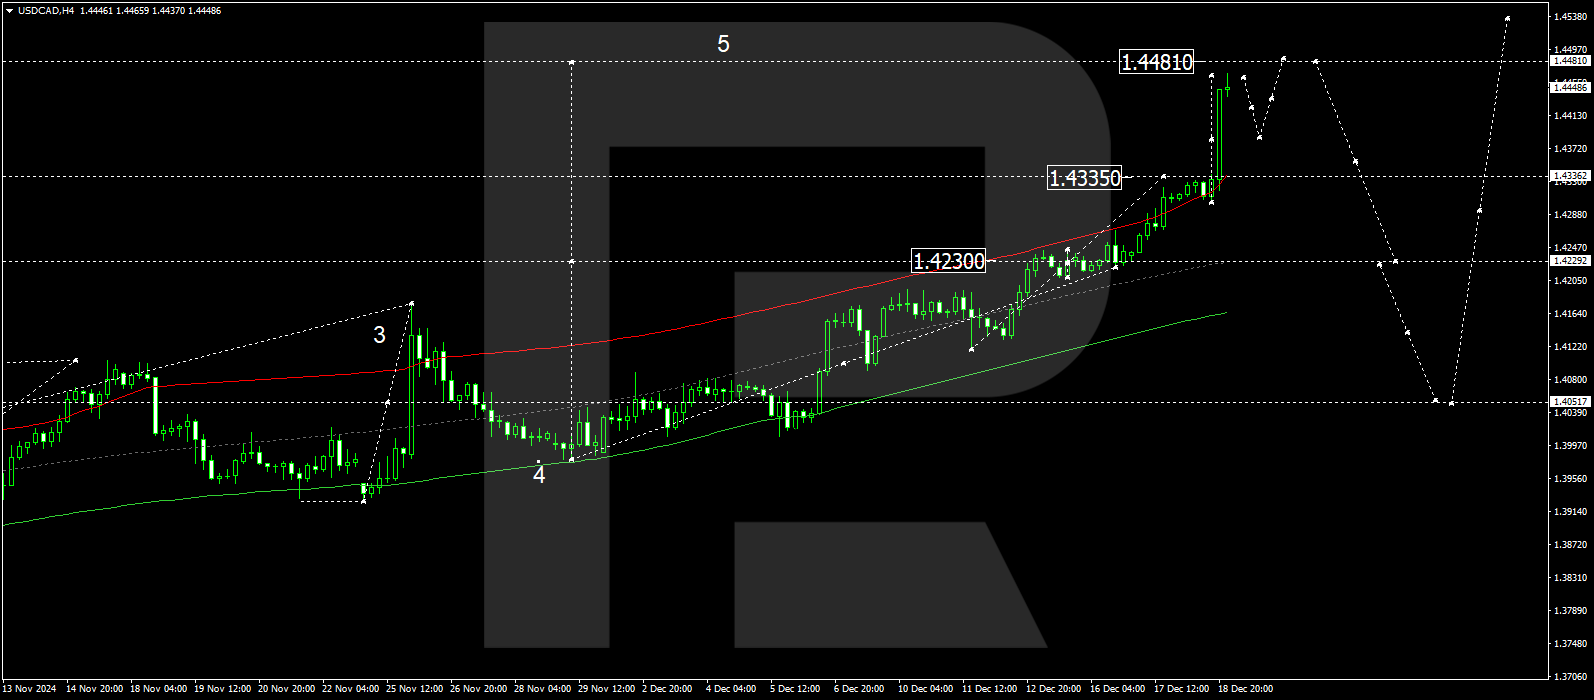
On the H4 chart, USDCAD found support at 1.4300, broke above 1.4333, and achieved a local growth wave target of 1.4465. Today, 19 December 2024, a decline towards 1.4388 is anticipated. Subsequently, a new wave of growth towards 1.4480 is expected, marking the primary target. After reaching this level, a correction to 1.4230 may follow.
Technically, this scenario is confirmed by the indicated Elliott wave structure and the wave matrix centred at 1.4230. This level is considered pivotal for USDCAD in the current growth wave. The market continues to rise towards the upper boundary of the price envelope at 1.4480. After reaching this level, a wave of decline towards the central line of the envelope at 1.4230 is possible.
Technical indicators for today’s USDCAD forecast suggest the potential continuation of the growth wave to 1.4480.
XAUUSD forecast
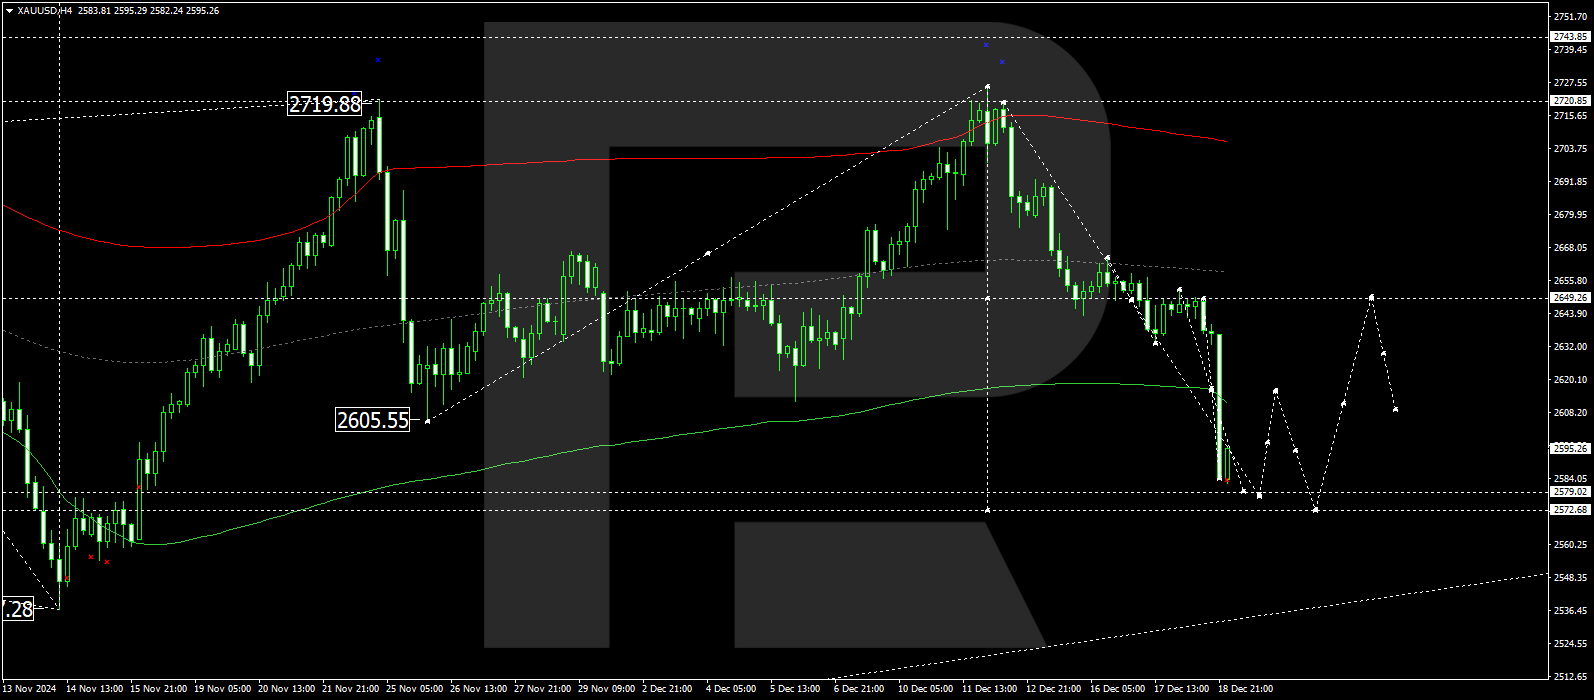
On the H4 chart, XAUUSD declined from resistance at 2,650.00, breaking below 2,630.00 and extending the downward wave towards 2,579.00. Today, 19 December 2024, the market has completed a decline to 2,583.00. A rise towards 2,616.00 is expected, followed by the continuation of the downward wave to 2,579.00, the local target.
Technically, this scenario is supported by the indicated Elliott wave structure and the wave matrix, centred at 2,650.00. This level is considered pivotal for the downtrend in XAUUSD. Currently, the market is likely to extend the wave towards the lower boundary of the price envelope at 2,579.00. After reaching this level, a rise towards the central line of the envelope at 2,620.00 is possible.
Technical indicators for today’s XAUUSD forecast suggest the potential for a decline to 2,579.00.
Brent forecast
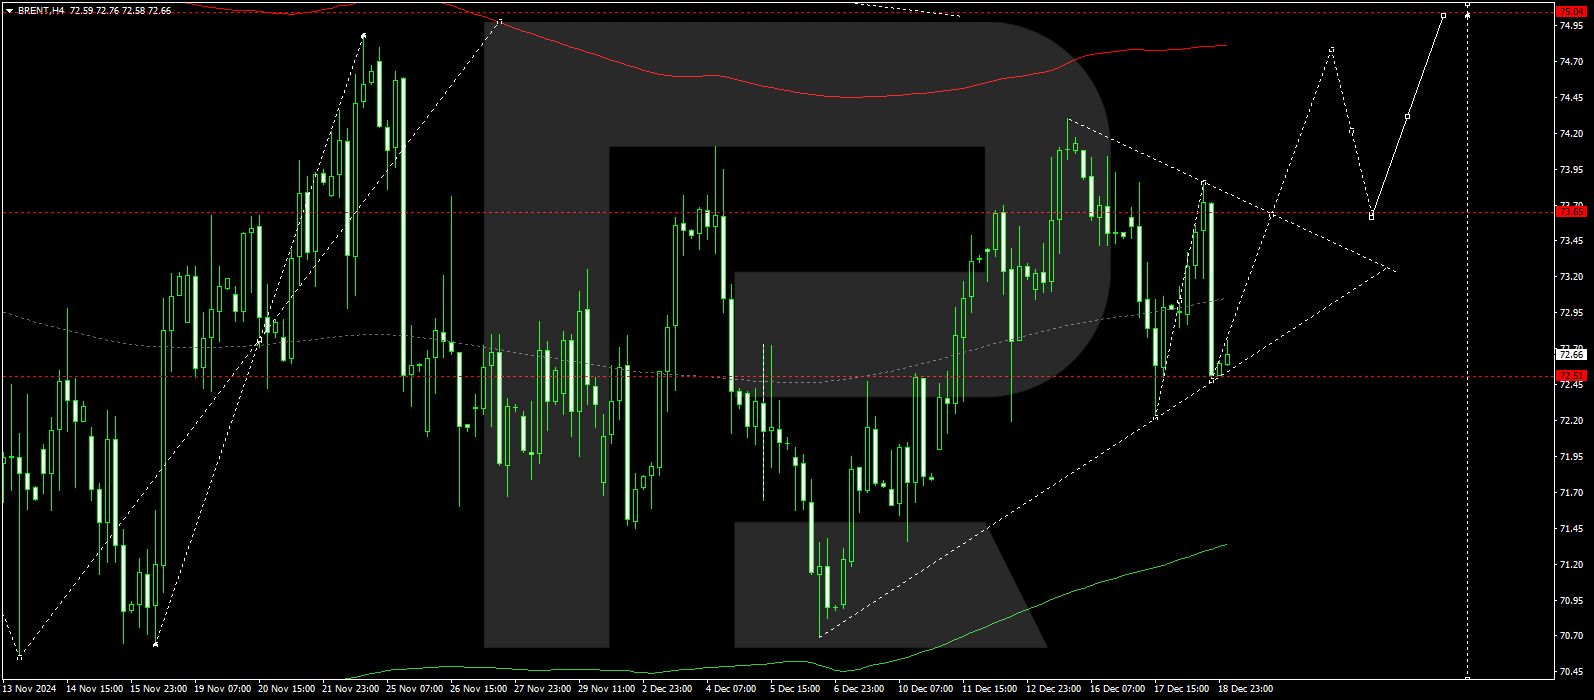
On the H4 chart, Brent crude oil achieved a growth wave target of 73.86. Today, 19 December 2024, a technical pullback to 72.50 (retesting from above) has been completed. Subsequently, a new wave of growth towards 74.00 is expected, with the trend likely to extend to 75.05. If this level is breached, the trend may continue towards 79.00, the local target.
Technically, this scenario is supported by the indicated Elliott wave structure and the wave matrix, centred at 72.55. This level is considered pivotal for Brent. Currently, the market is consolidating around the central line of the price envelope at 72.55. Further growth towards the upper boundary of the envelope at 75.05 is possible today.
Technical indicators for today’s Brent forecast suggest the potential for growth to 74.00 and 75.05.
