EURUSD, USDJPY, GBPUSD, AUDUSD, USDCAD, XAUUSD, and Brent technical analysis and forecast for 20 December 2024
Here is a detailed daily technical analysis and forecast for EURUSD, USDJPY, GBPUSD, AUDUSD, USDCAD, XAUUSD, and Brent for 20 December 2024.
EURUSD forecast
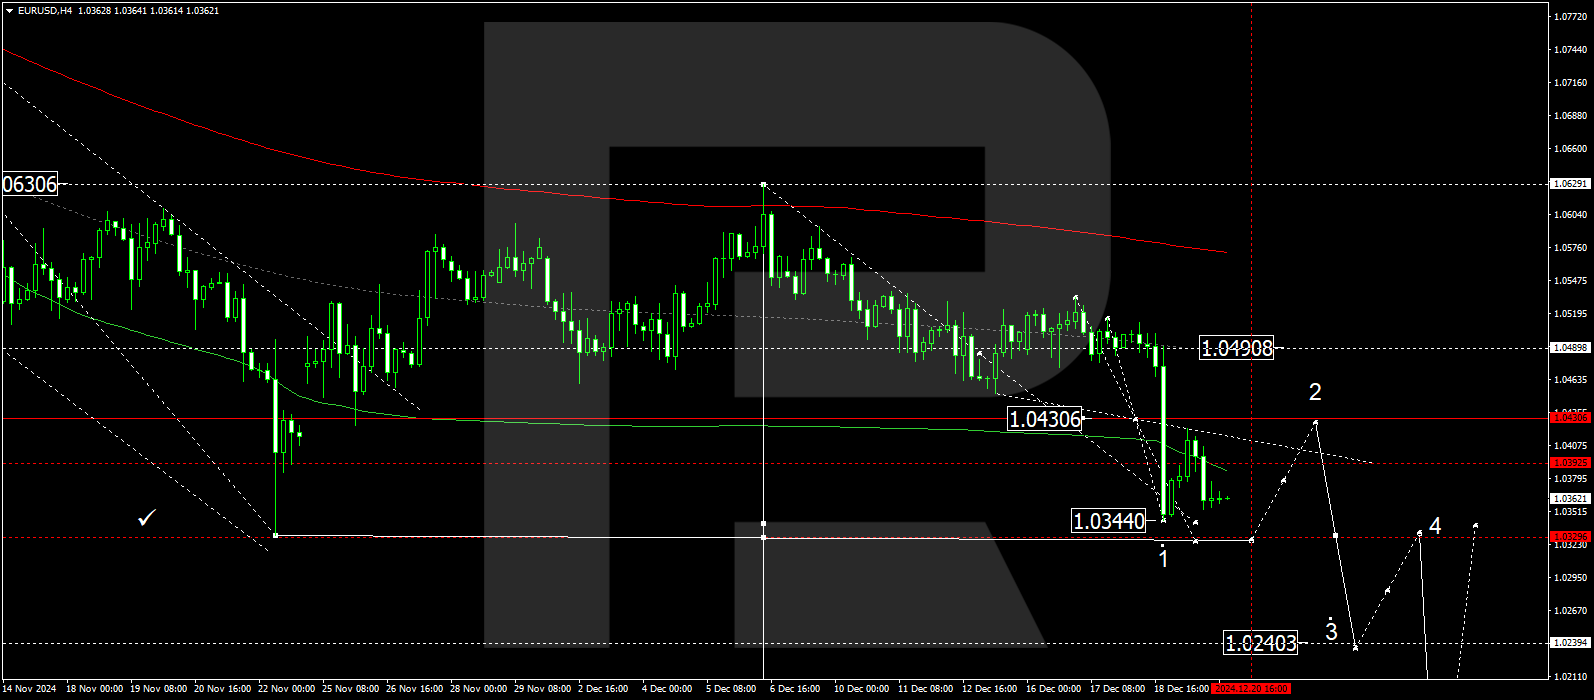
On the H4 EURUSD chart, the market has completed a corrective wave structure to 1.0420. Today, 20 December 2024, we expect a downward wave to develop towards 1.0330. Subsequently, a correction to the level of 1.0430 is anticipated. After the correction, the market is expected to decline further towards 1.0240, the local target.
Technically, this scenario is supported by the specified Elliott wave structure and the matrix for the initial downward wave, with the pivot point at 1.0490. This pivot is considered key for the EURUSD rate in this wave of decline. At present, the market has rebounded downwards from the central line of the price envelope at 1.0533 and is forming a wave structure towards its lower boundary at 1.0330. Once this level is reached, a correction to 1.0430 is expected, with the potential for the upward structure to extend towards the upper boundary of the price envelope at 1.0490.
Technical indicators for today’s EURUSD forecast suggest a potential decline to 1.0330.
USDJPY forecast
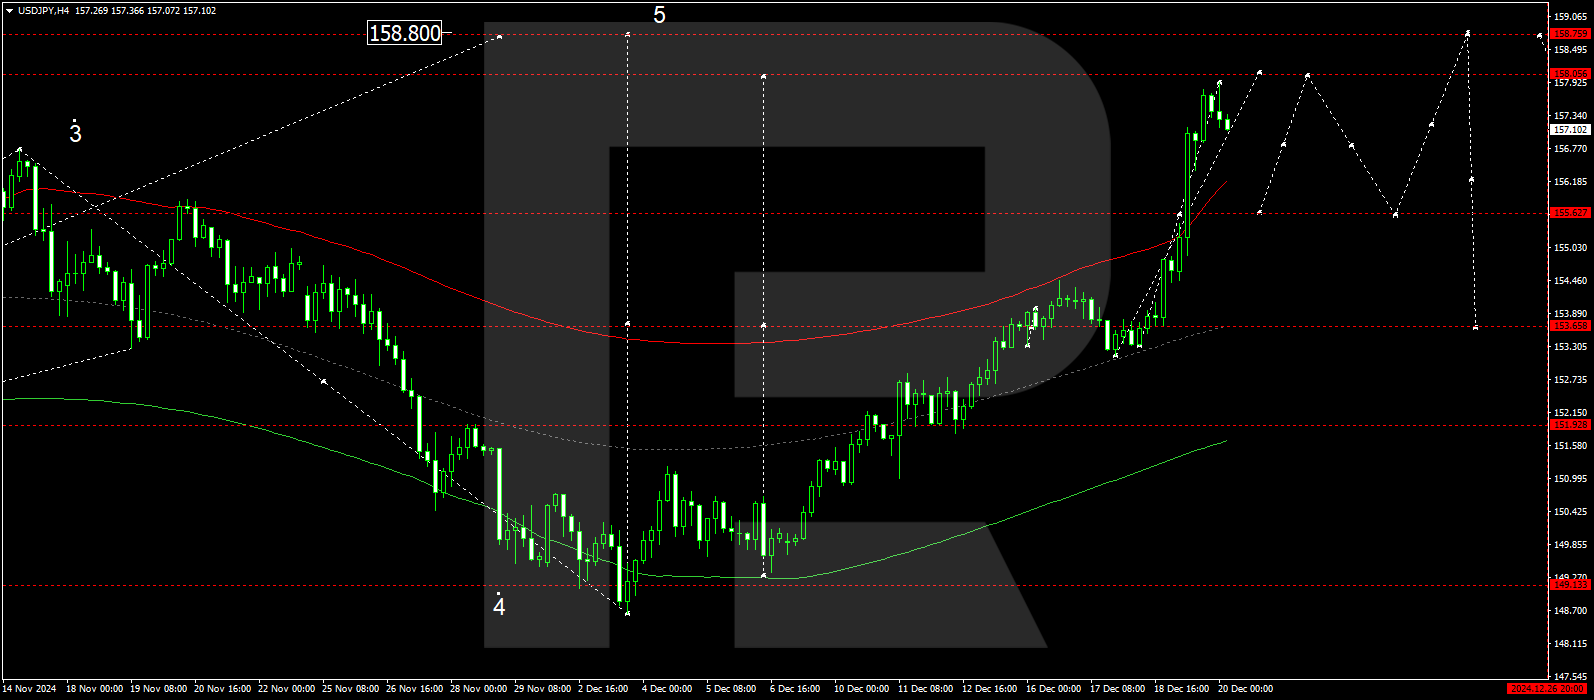
On the H4 chart, USDJPY has completed a growth wave to the 157.90 level. Today, 20 December 2024, a technical pullback and a test of 155.60 from above is possible. We then expect the start of a new growth wave towards 158.10. After reaching this level, a correction to 153.53 may follow. Once this correction is complete, we will consider the likelihood of a new growth wave towards 158.80, the primary target.
Technically, this scenario for the USDJPY exchange rate is confirmed by the Elliott wave structure and the growth wave matrix with a pivot point at 153.53. The market is currently near the upper boundary of the price envelope at 157.90. It is relevant to consider a decline to the 155.60 level. We expect further growth towards the upper boundary of the envelope at 158.10. After reaching this target level, we will consider the start of a downward wave towards its central line at 153.53.
Technical indicators for today’s forecast for the USDJPY pair suggest a potential decline to 155.60, followed by a rise towards 158.10.
GBPUSD forecast
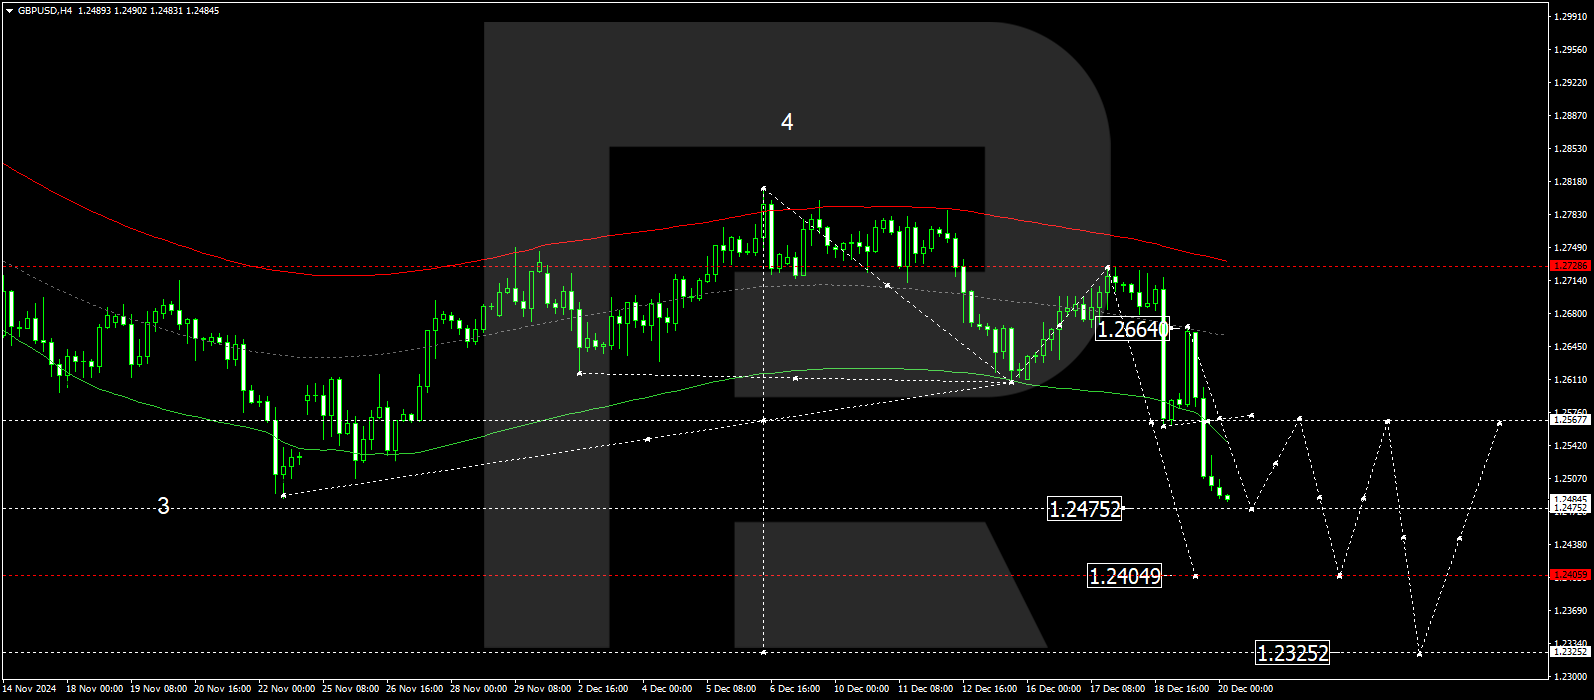
On the H4 chart for the GBPUSD pair, the market has bounced down from the 1.2664 level and broken through the 1.2565 level. A descending wave structure is forming towards the 1.2475 level. Today, 20 December 2024, we will consider the possibility of it reaching this level. We then expect the development of a corrective leg towards 1.2565 (a test from below). After that, we anticipate the start of a new downward wave towards 1.2405, the local target.
Technically, the Elliott wave structure and the wave matrix with a pivot point at 1.2565 confirm this scenario for the GBPUSD exchange rate. The market has bounced from the envelope’s central line at 1.2664 and continues developing the downward wave towards 1.2475, the local target. In practical terms, we are considering continuing the downward wave structure towards the lower boundary of the price Envelope at 1.2405.
Technical indicators for today’s forecast for the GBPUSD pair suggest a continuation of the downward wave towards the 1.2474 and 1.2405 levels.
AUDUSD forecast
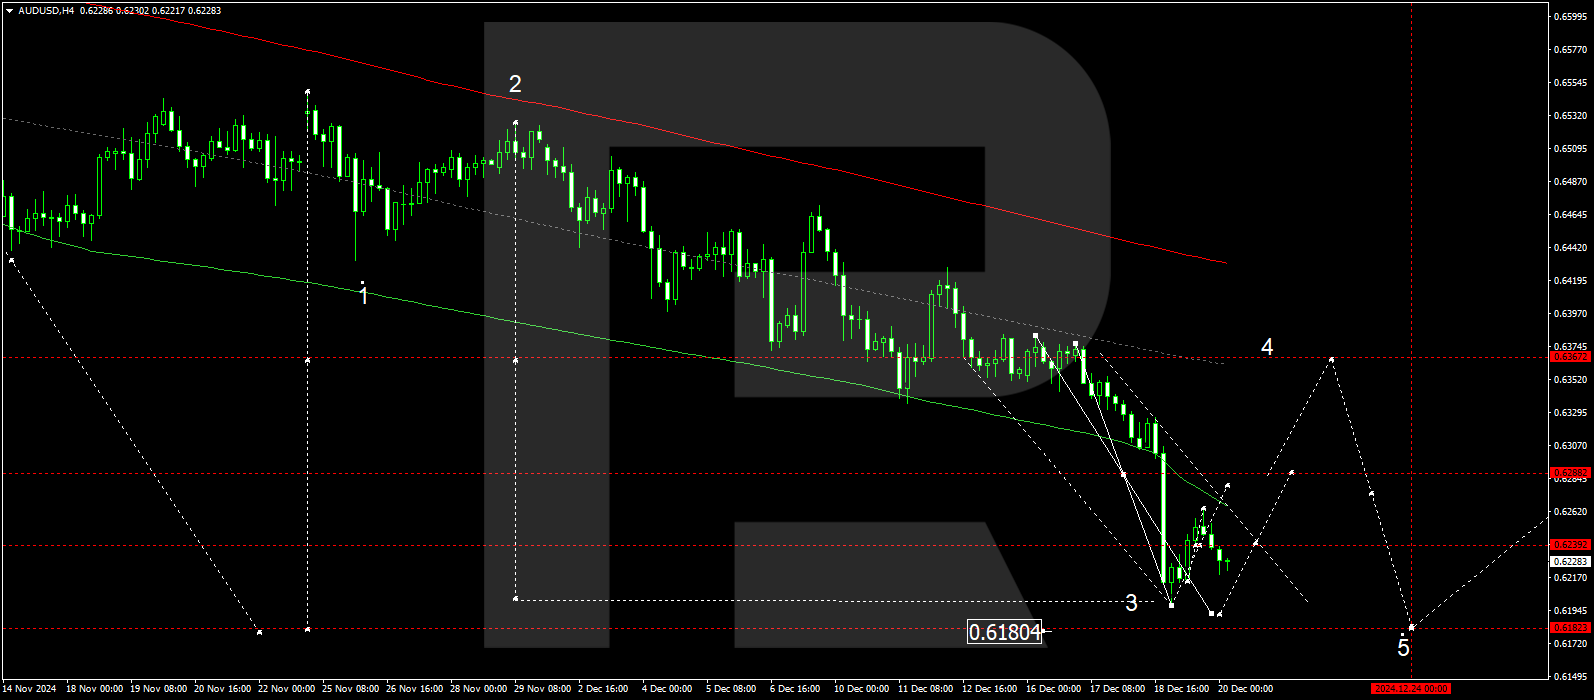
On the H4 chart for the AUDUSD pair, the market is forming a consolidation range around the 0.6240 level. Today, 20 December 2024, a downward extension to the 0.6190 level is possible. After reaching this level, we will consider the likelihood of a growth wave and an upward expansion of the range towards 0.6277. In the event of a breakout upwards, a correction to 0.6363 (test from below) is likely. After completing this correction, we will consider the development of another downward wave towards 0.6180, the primary target.
Technically, this scenario is confirmed by the Elliott wave structure and the downward wave matrix for the AUDUSD exchange rate, with a pivot point at 0.6363. The market has already achieved the local target of the downward wave at 0.6200 and continues to form a consolidation range near the lower boundary of the price envelope. Today, the development of a downward wave to 0.6190 is possible. In the future, we will focus on the likelihood of a growth wave towards the envelope’s central line at 0.6363.
Technical indicators for today’s forecast for the AUDUSD pair suggest a potential decline to 0.6190, followed by a rise towards 0.6277.
USDCAD forecast
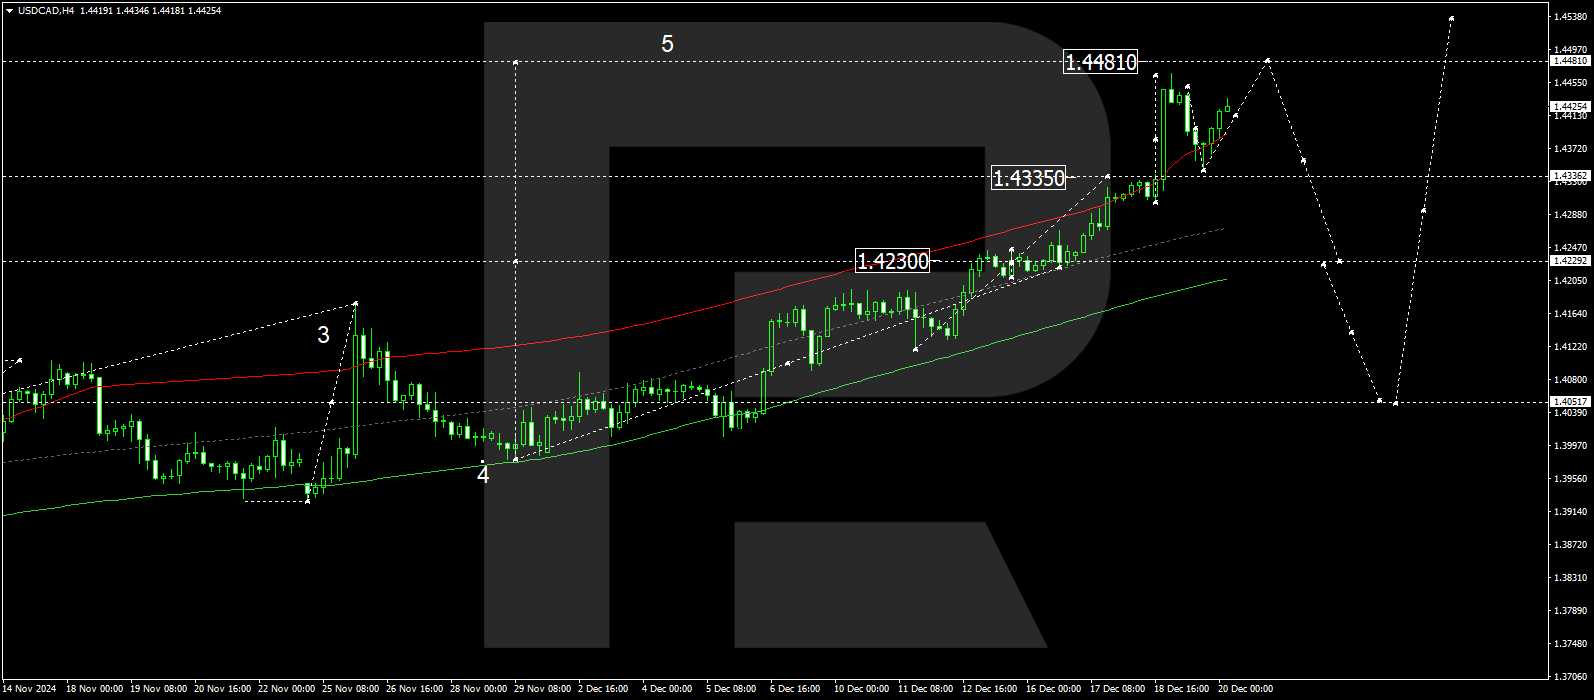
On the H4 chart for the USDCAD pair, the market has completed a growth wave to the 1.4465 level and a correction to the 1.4344 level. Today, 20 December 2024, we expect a growth wave towards 1.4481. The target is local. In the future, we will consider the development of a corrective wave to the 1.4230 level. After this correction is complete, a growth wave towards 1.4550 may begin.
Technically, this scenario is confirmed by the Elliott wave structure and the wave matrix with a pivot point at 1.4230. This level is considered key for the USDCAD exchange rate within the growth wave structure. The market continues to rise towards the upper boundary of the price envelope at 1.4481. After reaching this level, a downward wave to its central line at 1.4230 is possible.
Technical indicators for today’s forecast for the USDCAD pair suggest a potential continuation of the growth wave to 1.4481.
XAUUSD forecast
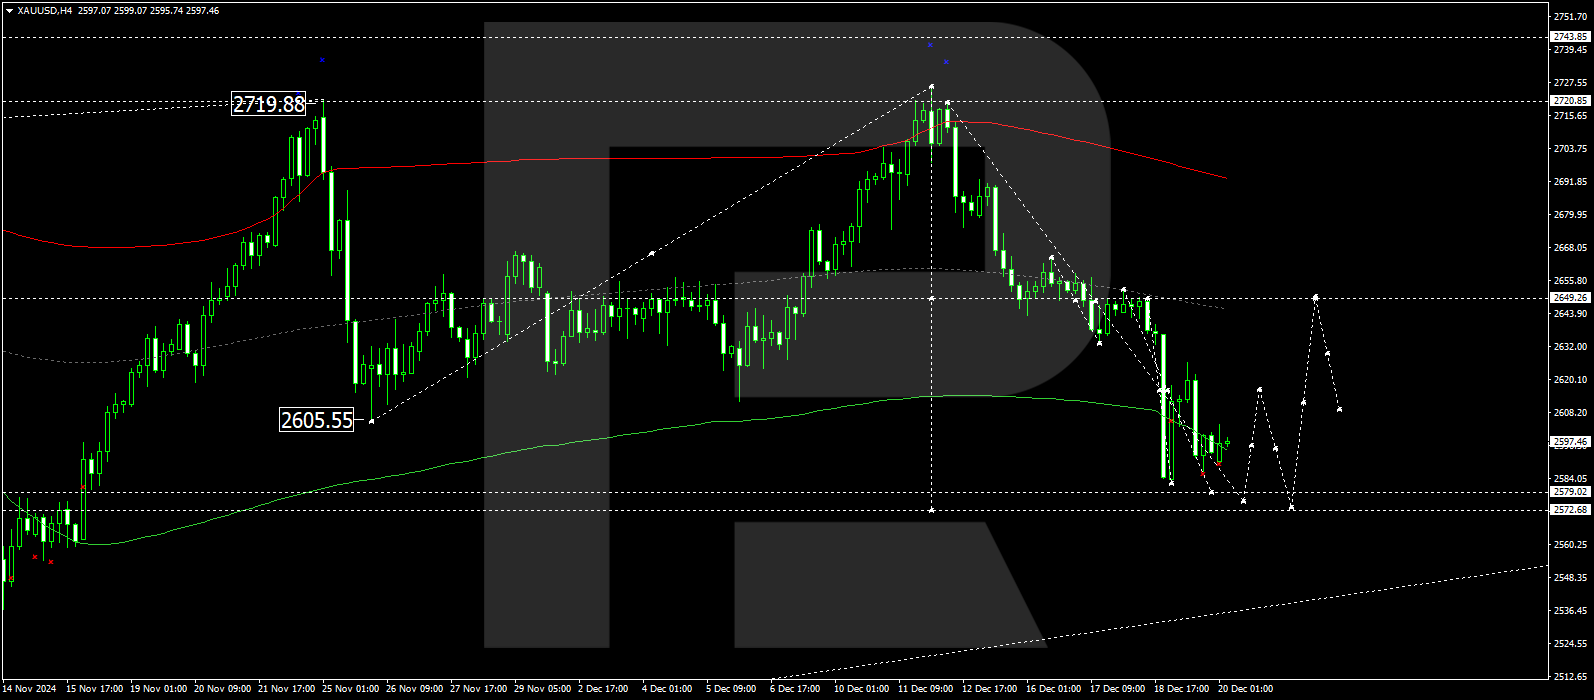
On the H4 chart for XAUUSD, the market has bounced down from the 2,626.26 level and continues to develop a downward wave towards 2,579.00. Today, 20 December 2024, we expect this target level to be reached. In the future, we will consider the possibility of a growth leg towards 2,616.16. Then, another downward wave to the 2,572.70 level may develop. This will mark the exhaustion of the corrective downward wave’s potential.
Technically, the Elliott wave structure and the wave matrix with a pivot point at 2,650.00 confirm this scenario. This level is considered key for the XAUUSD exchange rate’s downward trend. Currently, the focus will be on continuing the wave towards the lower boundary of the envelope at 2,579.00. After reaching this level, a growth leg towards its central line at 2,650.00 is possible.
Technical indicators for today’s forecast for XAUUSD suggest a potential decline to 2,579.00.
Brent forecast
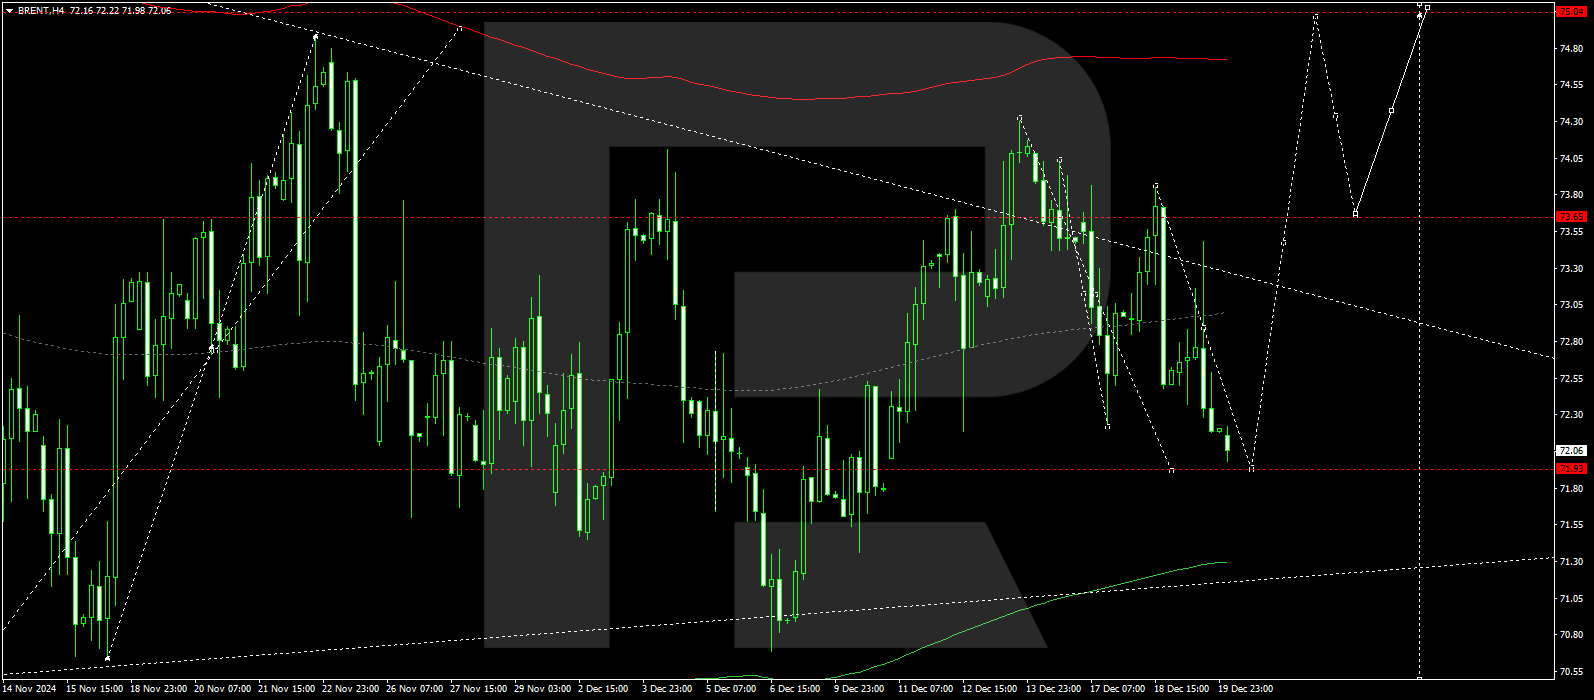
On the H4 chart for Brent crude oil, the market continues to develop a consolidation range around the 73.13 level. Today, 20 December 2024, we will consider the possibility of a downward structure towards 71.93. After reaching this level, a growth wave towards 73.13 may begin. In the event of a breakout, there is potential for a growth wave towards 75.05.
Technically, this scenario is confirmed by the Elliott wave structure and the wave matrix with a pivot point at 73.13. This level is considered key for the Brent price. Currently, the market continues to form a consolidation range around the central line of the price envelope at 73.13. Today, the focus will be on the continuation of the decline towards its lower boundary at 71.93. In the future, we expect the start of a growth wave towards the upper boundary of the envelope at 75.05.
Technical indicators suggest that the probability of growth towards 73.13 and 75.05 should be considered in today’s forecast for Brent crude oil.
