EURUSD, USDJPY, GBPUSD, AUDUSD, USDCAD, XAUUSD, and Brent technical analysis and forecast for 20 January 2025
Here is a detailed daily technical analysis and forecast for EURUSD, USDJPY, GBPUSD, AUDUSD, USDCAD, XAUUSD, and Brent for 20 January 2025.
EURUSD forecast
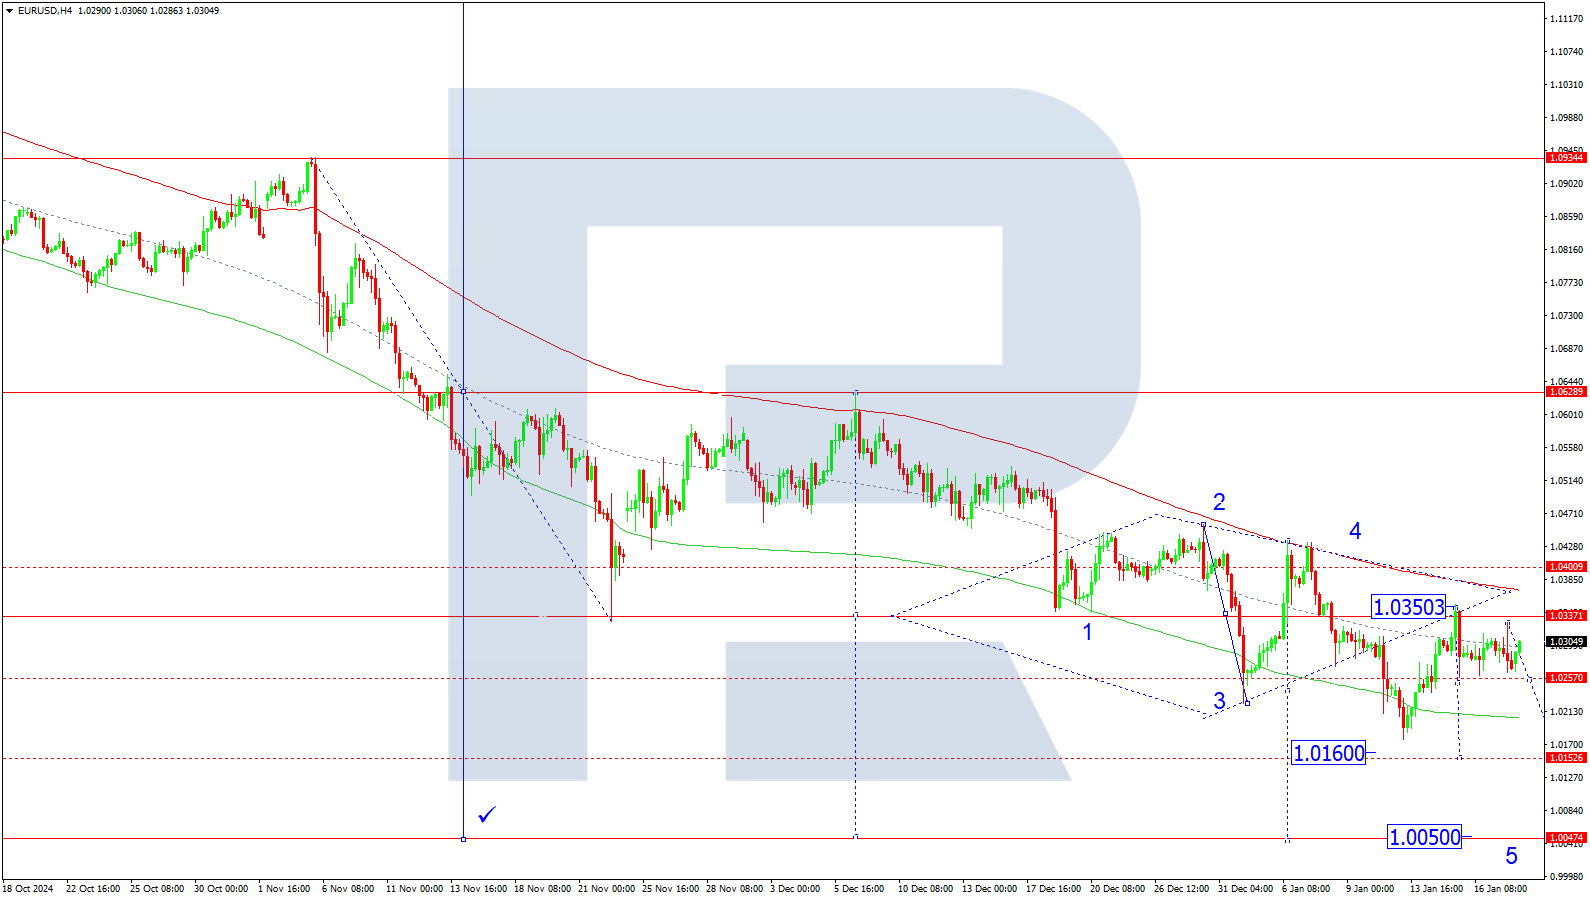
On the H4 chart, EURUSD is consolidating above 1.0250. A potential rise to 1.0311 is possible. On 20 January 2025, a decline to 1.0250 is expected. If this level is breached, further movement to 1.0200 is likely, followed by a correction to 1.0250 (retesting from below). Subsequently, a downward wave to 1.0160 is anticipated, and the trend may extend to 1.0050. If the market breaks upwards from the range, growth towards 1.0400 may occur before a further decline to 1.0050, the main target.
Technically, this scenario aligns with the Elliott Wave structure and the fifth-wave downward matrix centred at 1.0350, which is key for EURUSD. The market is shaping a downward wave towards the lower boundary of the price Envelope at 1.0160, followed by a potential correction to its central line at 1.0250.
Technical indicators for today’s EURUSD forecast suggest potential declines to 1.0250, 1.0200, and 1.0160.
USDJPY forecast
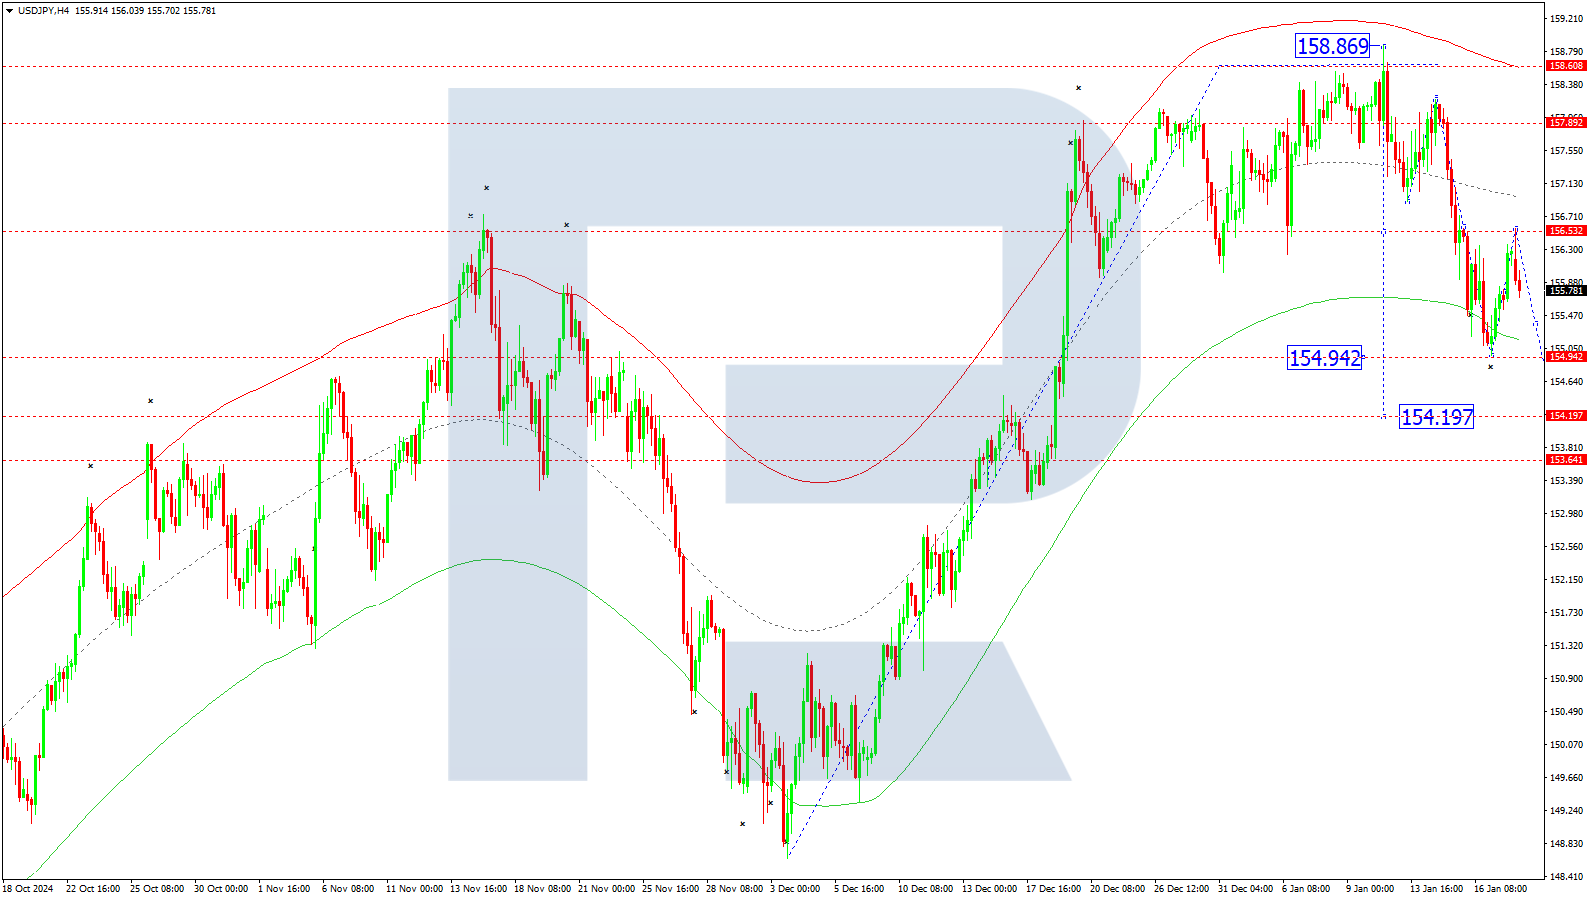
On the H4 chart, USDJPY completed a downward wave to 154.94, followed by a correction to 156.53. On 20 January 2025, a new decline to 154.20 is expected. After reaching this level, a new upward wave towards 156.55 may develop.
Technically, this scenario aligns with the Elliott Wave structure and the correction matrix centred at 156.53. The market is currently near the central line of the price Envelope, with a potential decline to its lower boundary at 154.20.
Technical indicators for today’s USDJPY forecast suggest a possible correction to 154.20.
GBPUSD forecast
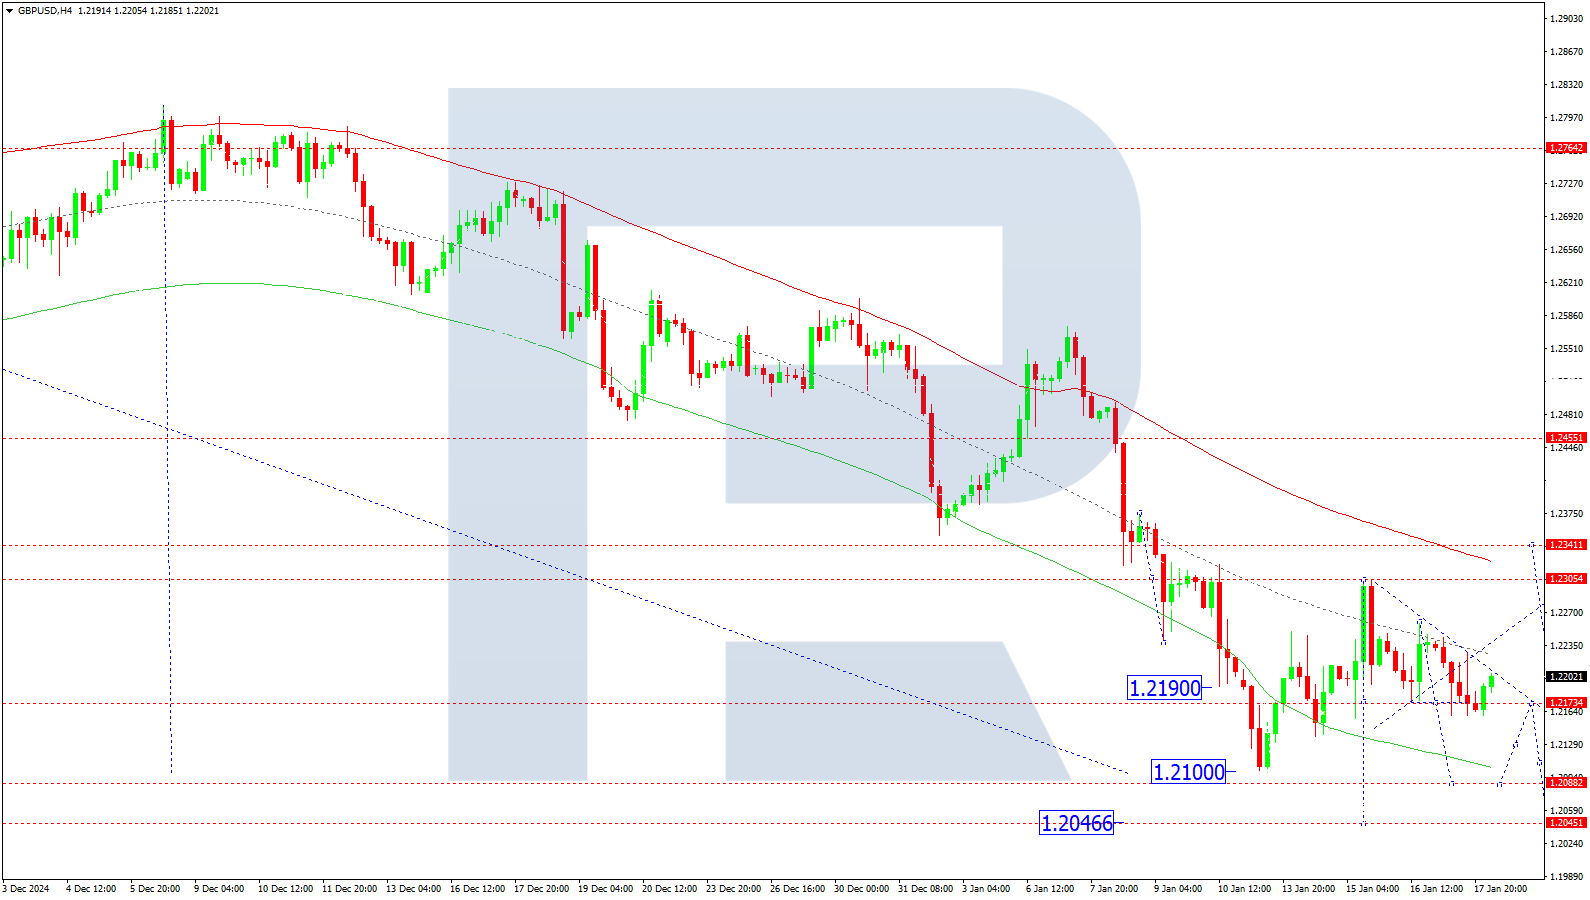
On the H4 chart, GBPUSD continues consolidating around 1.2222 without a clear trend. On 20 January 2025, a downward breakout could lead to a continuation of the trend to 1.2050. Conversely, an upward breakout may trigger a new growth wave to 1.2333 (retesting from below), which is the main target for this correction. After completing the correction, a new downward wave to 1.2050 is expected.
Technically, this scenario aligns with the Elliott Wave structure and the downward wave matrix centred at 1.2333. The market is consolidating below the central line of the price Envelope, with a downward wave to its lower boundary at 1.2050 expected.
Technical indicators for today’s GBPUSD forecast suggest an upward wave to 1.2333, followed by a decline to 1.2050.
AUDUSD forecast
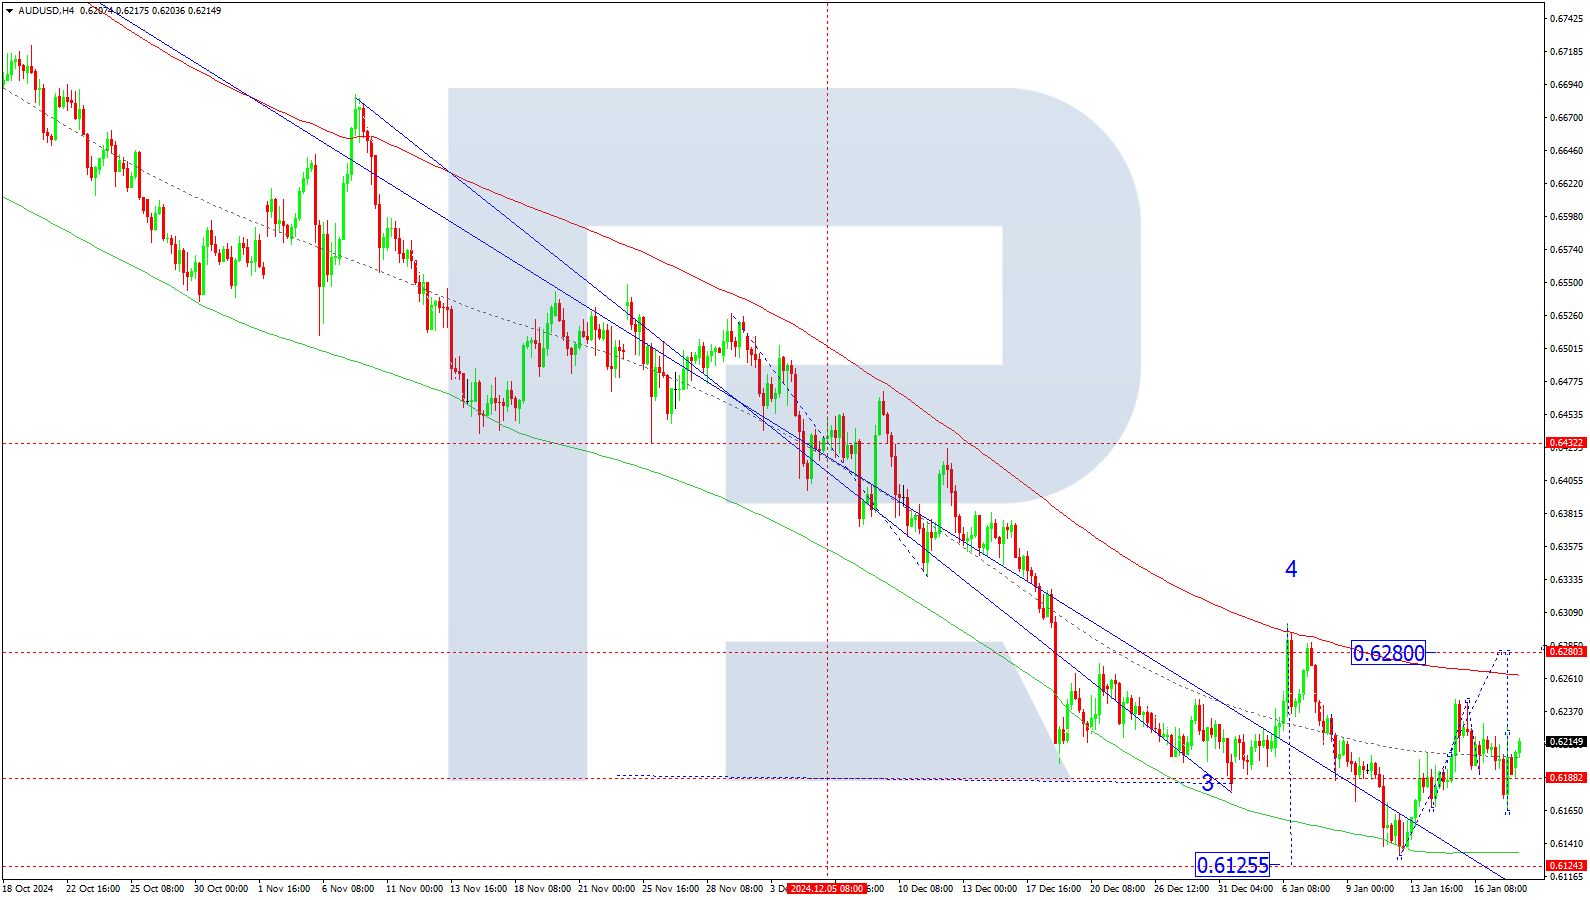
On the H4 chart, AUDUSD completed a downward wave to 0.6164, followed by a correction to 0.6220. The market is forming a consolidation range around this level. On 20 January 2025, a downward breakout could lead to a decline to 0.6120. After reaching this level, a new upward wave towards 0.6280 may develop. If the market breaks upwards from the range, growth to 0.6280 is possible before a downward wave to 0.6120.
Technically, this scenario aligns with the Elliott Wave structure and the downward wave matrix centred at 0.6220. The market is consolidating around the central line of the price Envelope, with a potential rise to its upper boundary at 0.6280, followed by a decline to its lower boundary at 0.6120.
Technical indicators for today’s AUDUSD forecast suggest a decline to 0.6120.
USDCAD forecast
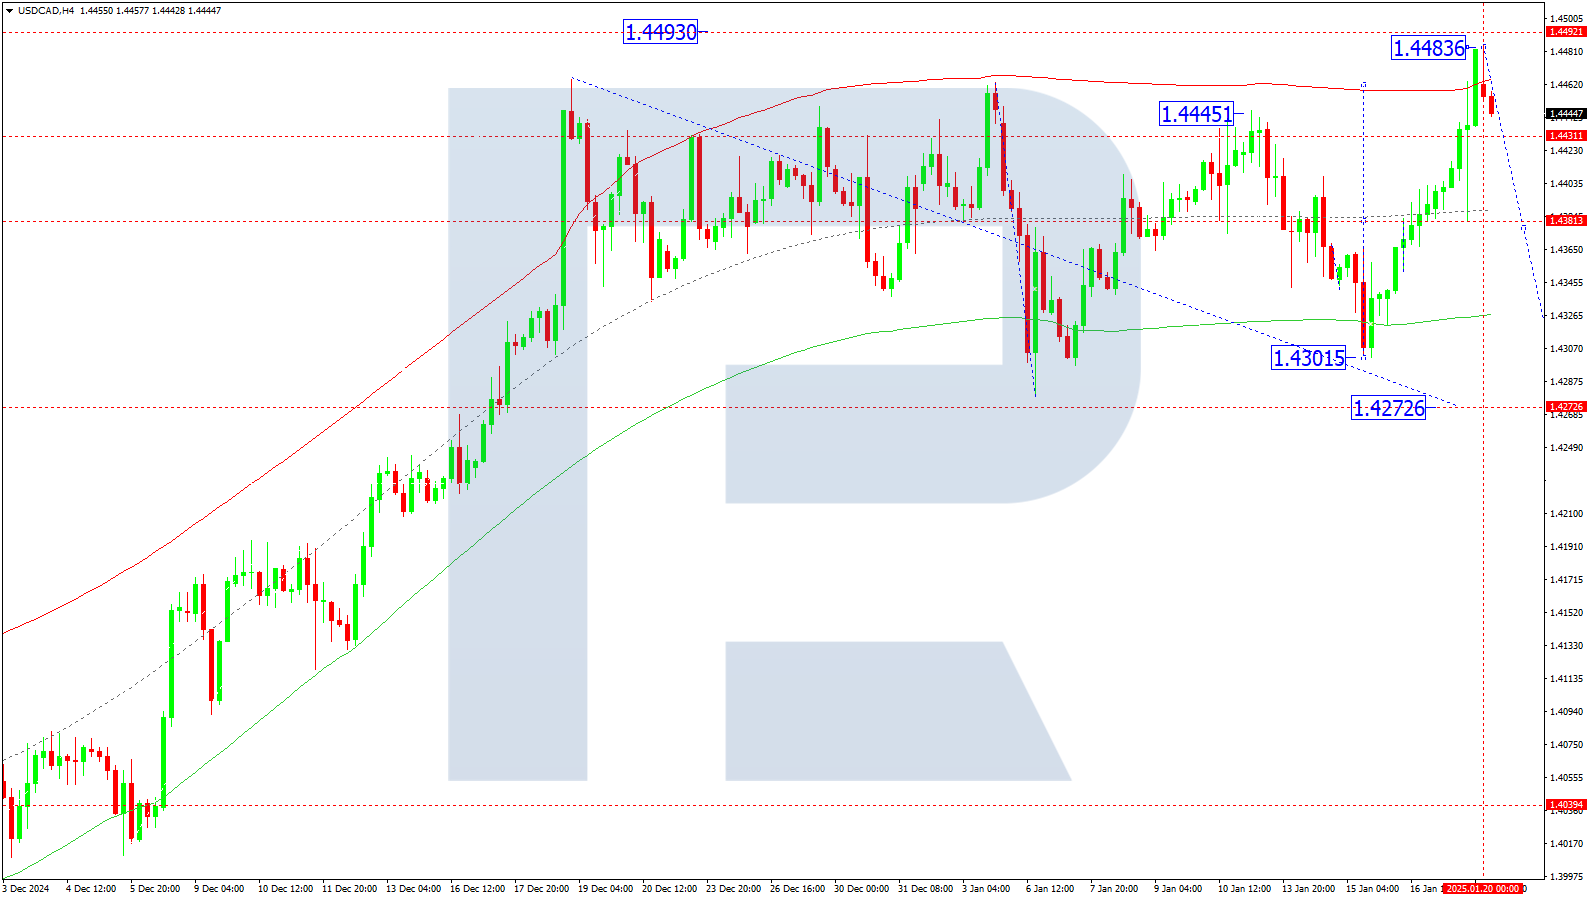
On the H4 chart, USDCAD found support at 1.4383 and completed a growth wave to 1.4484. On 20 January 2025, a decline to 1.4383 is anticipated. After reaching this level, a rebound to 1.4431 is possible. The market is expected to develop a broad consolidation range around 1.4383, with a potential downward extension to 1.4272, which is the target for this wave of decline.
Technically, this scenario aligns with the Elliott Wave structure and the downward wave matrix centred at 1.4383. The market has completed a growth wave to the upper boundary of the price Envelope at 1.4484, with a subsequent decline towards the lower boundary at 1.4272 anticipated.
Technical indicators for today’s USDCAD forecast suggest a downward wave to 1.4383.
XAUUSD forecast
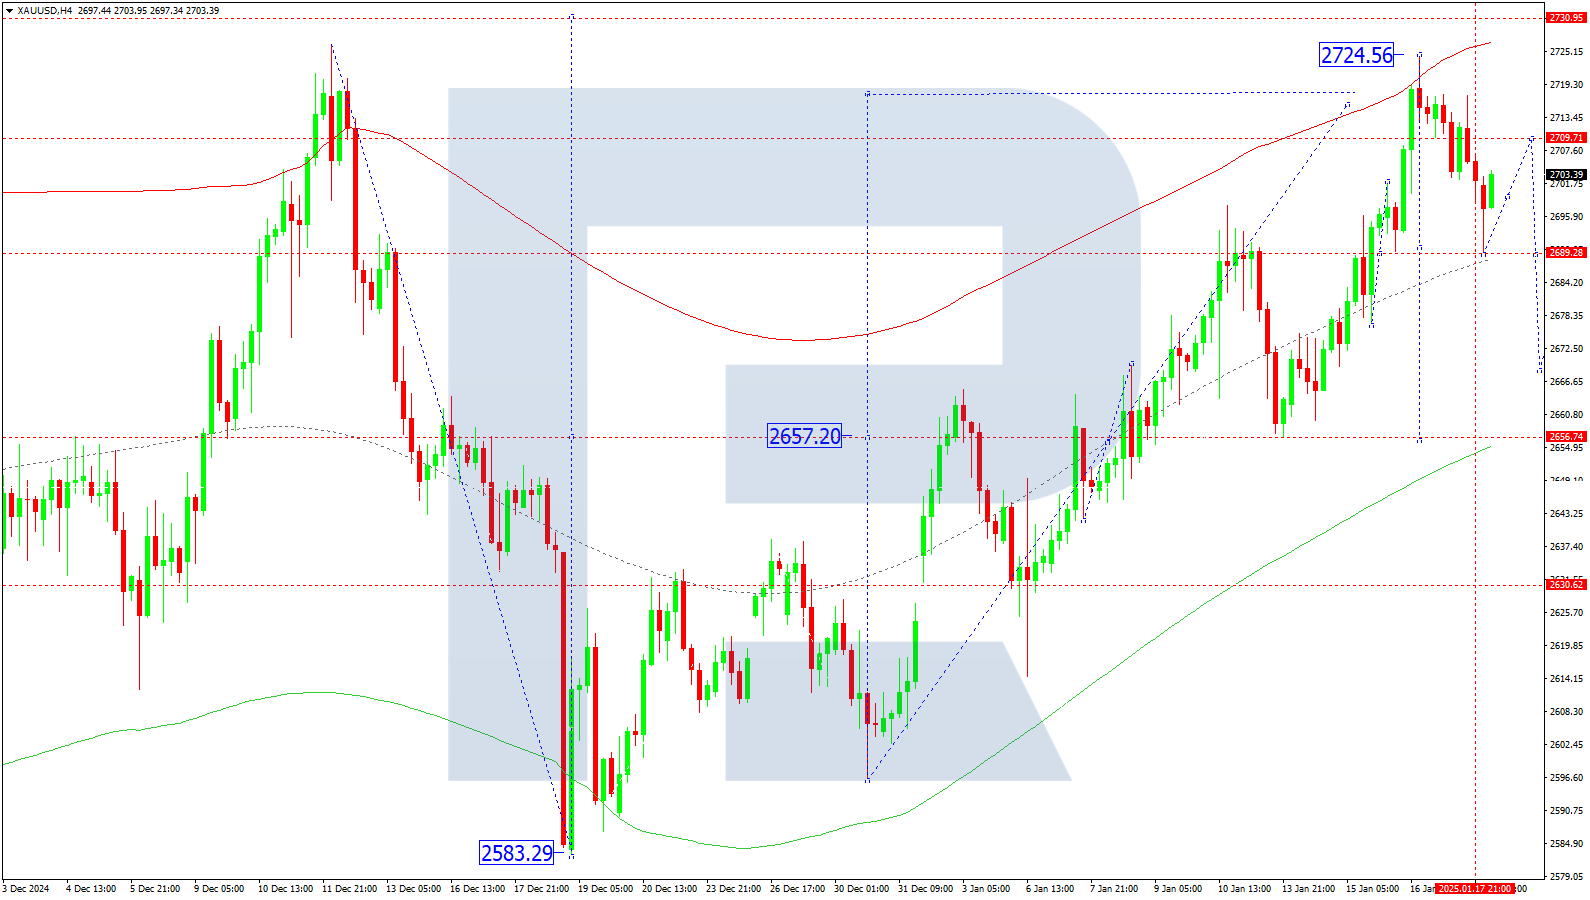
On the H4 chart, XAUUSD completed a downward wave to 2,689. On 20 January 2025, a rise to 2,709 is expected, with a consolidation range likely to form around this level. If the market breaks upwards, further growth to 2,730 may follow. A downward breakout could lead to a correction to 2,656.
Technically, this scenario aligns with the Elliott Wave structure and the downward wave matrix centred at 2,689, which is key for XAUUSD. The market is consolidating near the central line of the price Envelope at 2,689, with potential growth towards the upper boundary at 2,724 before a decline to the lower boundary at 2,656.
Technical indicators for today’s XAUUSD forecast suggest potential declines to 2,689 and 2,656.
Brent forecast
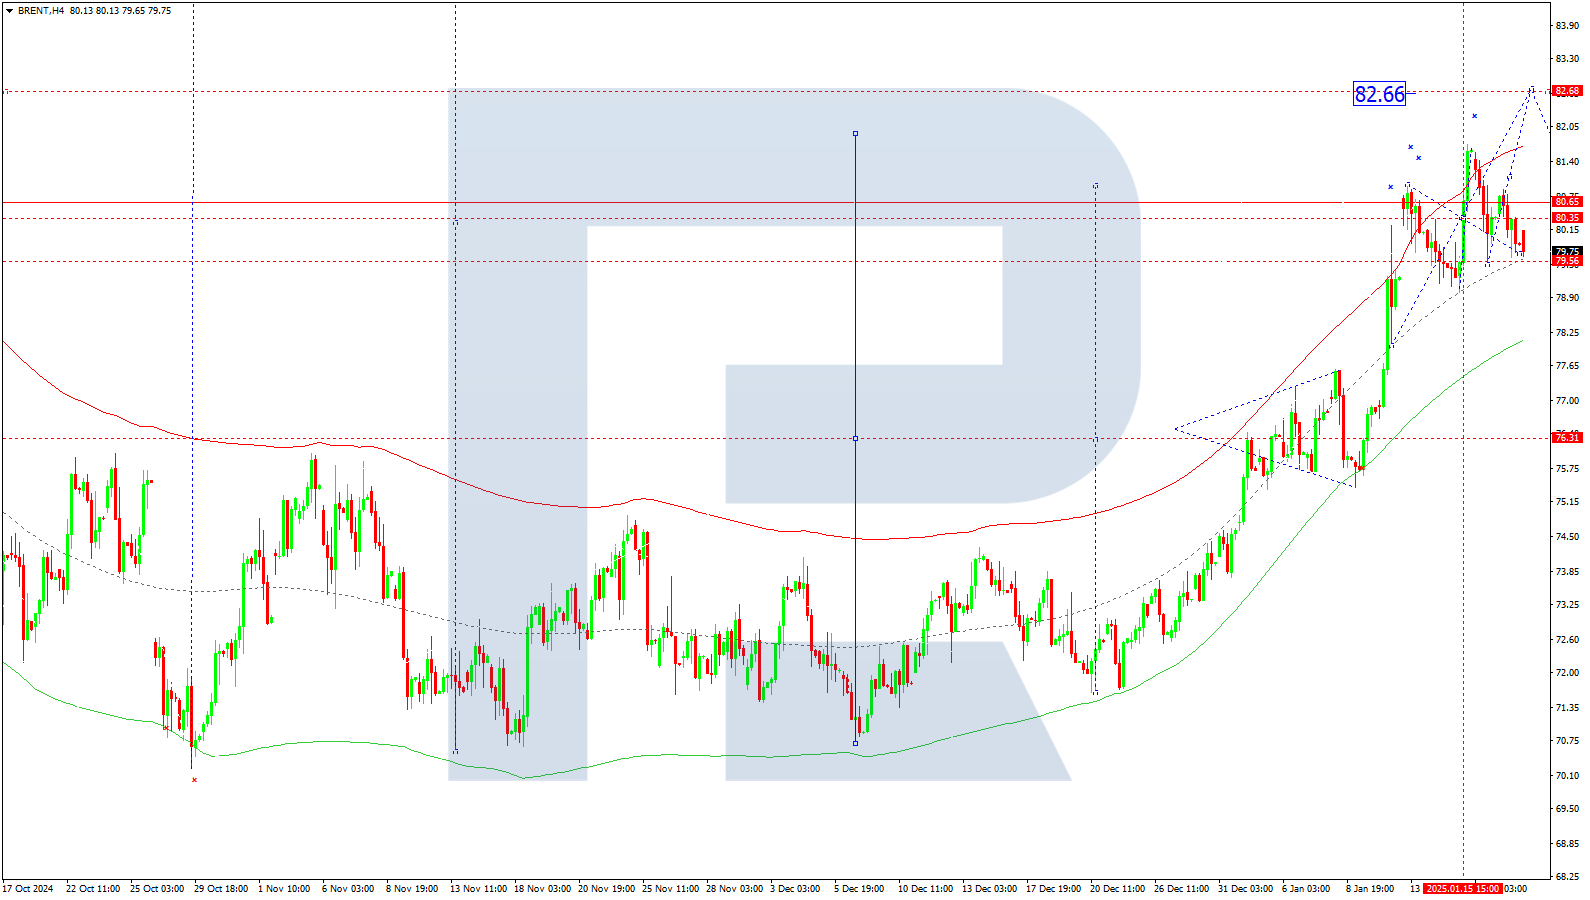
On the H4 chart, Brent crude is consolidating around 80.35. On 20 January 2025, an upward breakout could lead to further growth to 82.66. After reaching this level, a correction to 80.35 (retesting from above) may follow. Subsequently, growth to 86.46 is expected as a local target. If the market breaks downwards from the range, a move to 79.55 and further correction to 78.00 is possible. After completing the correction, the market will likely resume its upward trend towards 86.46.
Technically, this scenario aligns with the Elliott Wave structure and the growth wave matrix centred at 80.35. The market is expected to continue its upward wave towards the upper boundary of the price Envelope at 86.46, followed by a potential correction to its lower boundary at 80.35.
Technical indicators for today’s Brent forecast suggest a correction to 78.00 before resuming growth to 82.66.
