BTCUSD, “Bitcoin vs US Dollar”
As we can see in the H4 chart, the correctional downtrend has reached the retracement of 76.0% and may continue falling towards the low at 3121.90. However, there is a convergence on MACD, which may indicate a possible pullback towards the resistance level at 3678.00.


In the H1 chart, after finishing the short-term correctional uptrend, the pair is forming a new descending impulse. If the price breaks the low at 3342.70, the instrument may fall towards the post-correctional extension area between the retracements of 138.2% and 161.8% at 3294.00 and 3262.00 respectively. The local resistance is the high at 3472.50.


ETHUSD, “Ethereum vs. US Dollar”
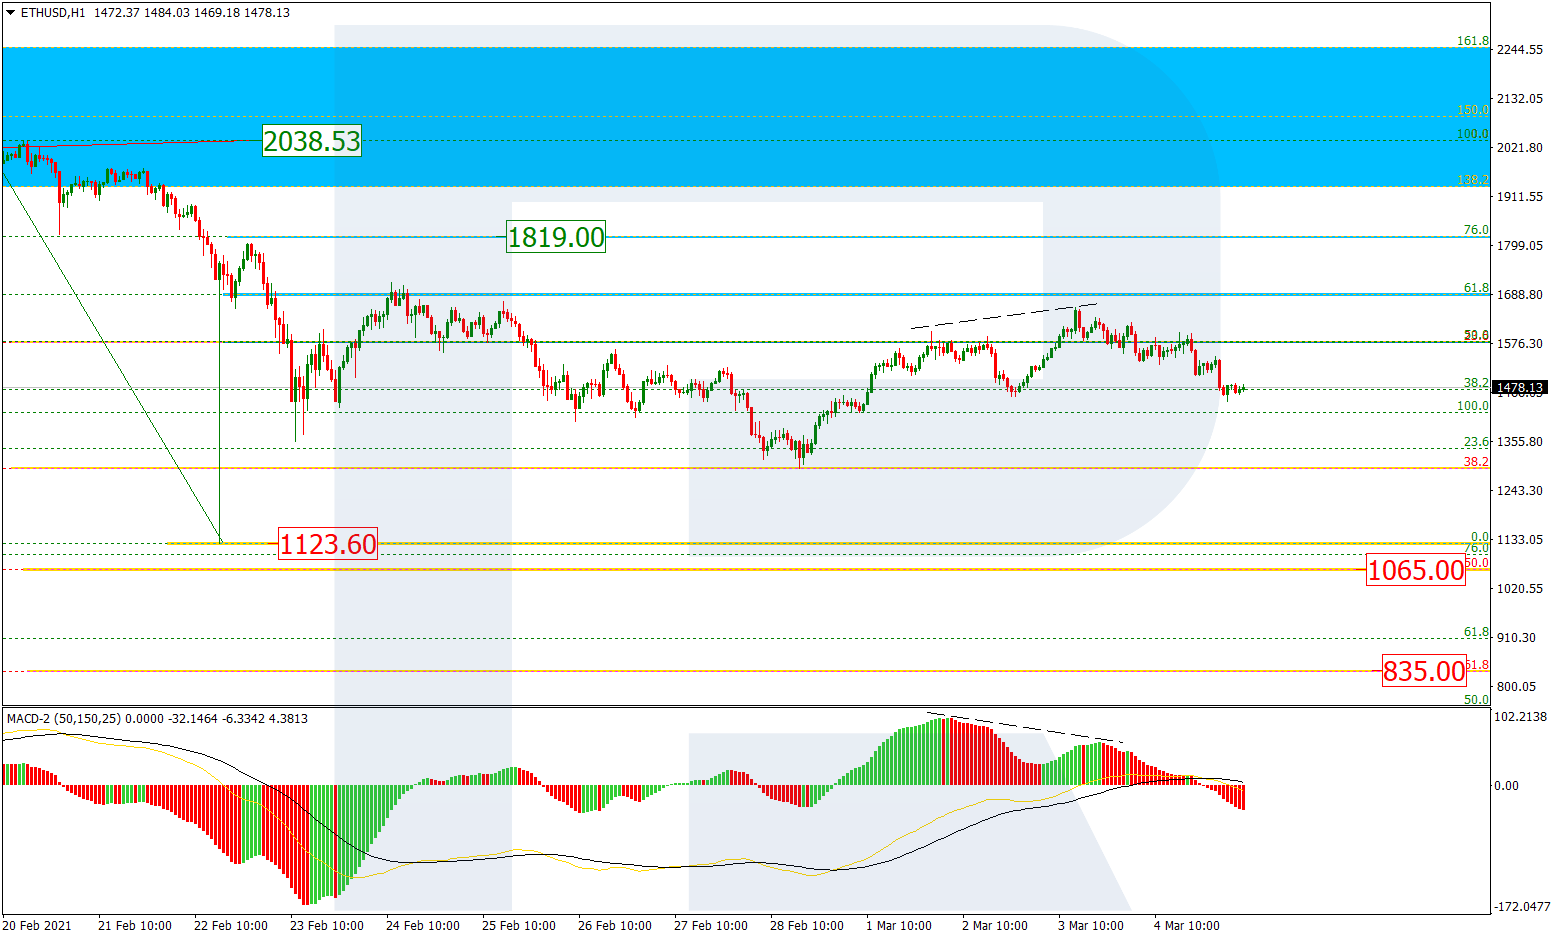
As we can see in the H4 chart, the downtrend has slowed down; the pair is trading between the retracements of 61.8% and 76.0% at 111.25 and 100.00 respectively. The key downside target is the low at 80.86. At the same time, there is a convergence on MACD, which may indicate a possible pullback in the short-term.


In the H1 chart, the pair is forming a new descending impulse with the closest target at 101.00. If the price breaks this level, the instrument may continue falling towards the post-correctional extension area between the retracements of 138.2% and 161.8% at 97.55 and 95.38 respectively.

