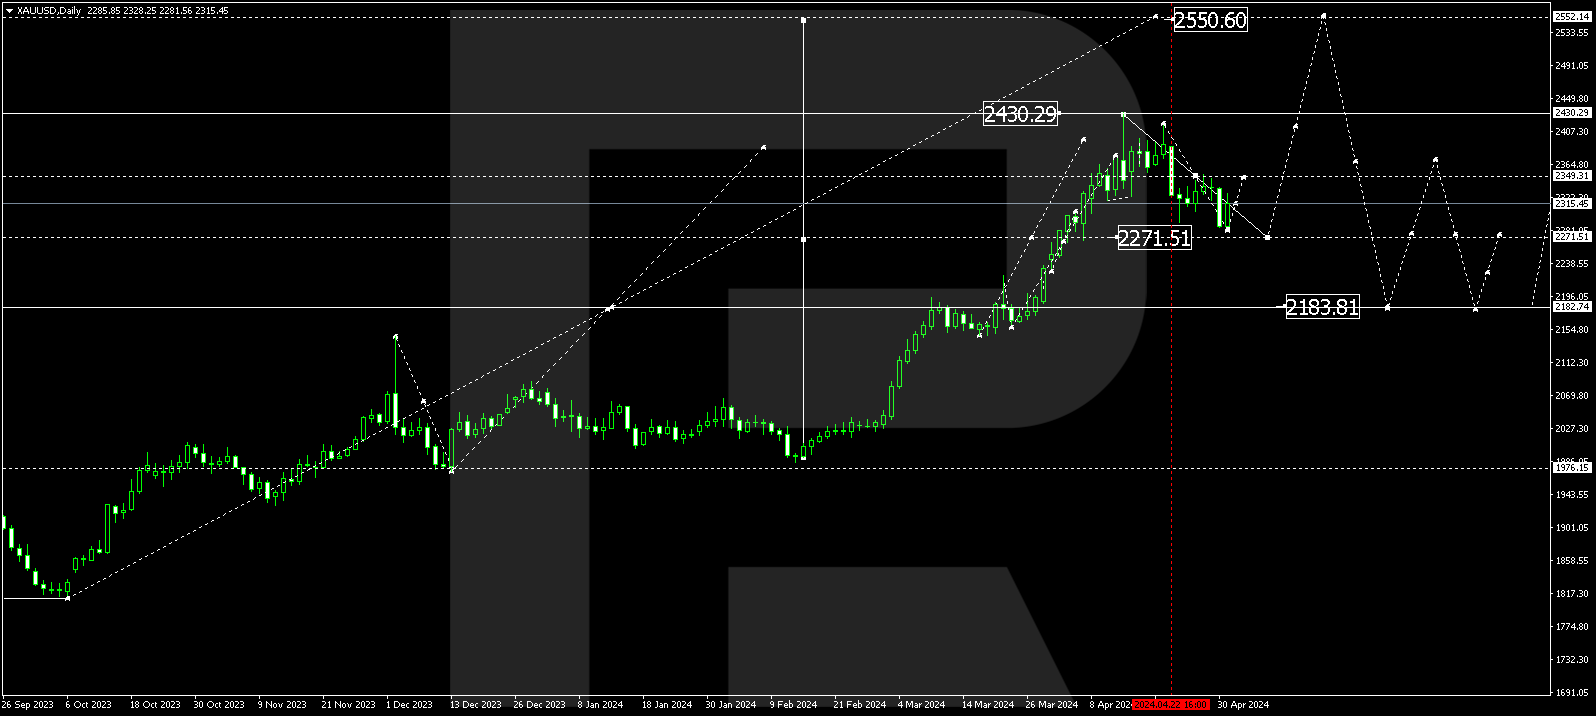
XAUUSD, “Gold vs US Dollar”
In the daily chart, the long-term correction continues; the previous descending impulse has reached 38.2% fibo. After a slight pullback, the price may continue falling towards 50.0% and 61.8% fibo at 1617.50 and 1509.85 respectively. However, there is a convergence on MACD, which may hint at a possible reversal and a new ascending wave after the instrument reaches one of its key downside targets. The key resistance is the high at 2074.75.

In the H4 chart, a local convergence made the pair start a new pullback after reaching the long-term 38.2% fibo. The possible correctional targets are 23.6%, 38.2%, and 50.0% fibo at 1774.20, 1809.80, and 1838.45 respectively. However, if the price breaks the local low at 1717.15, XAUUSD may continue falling to reach the long-term 50.0% fibo at 1617.50.

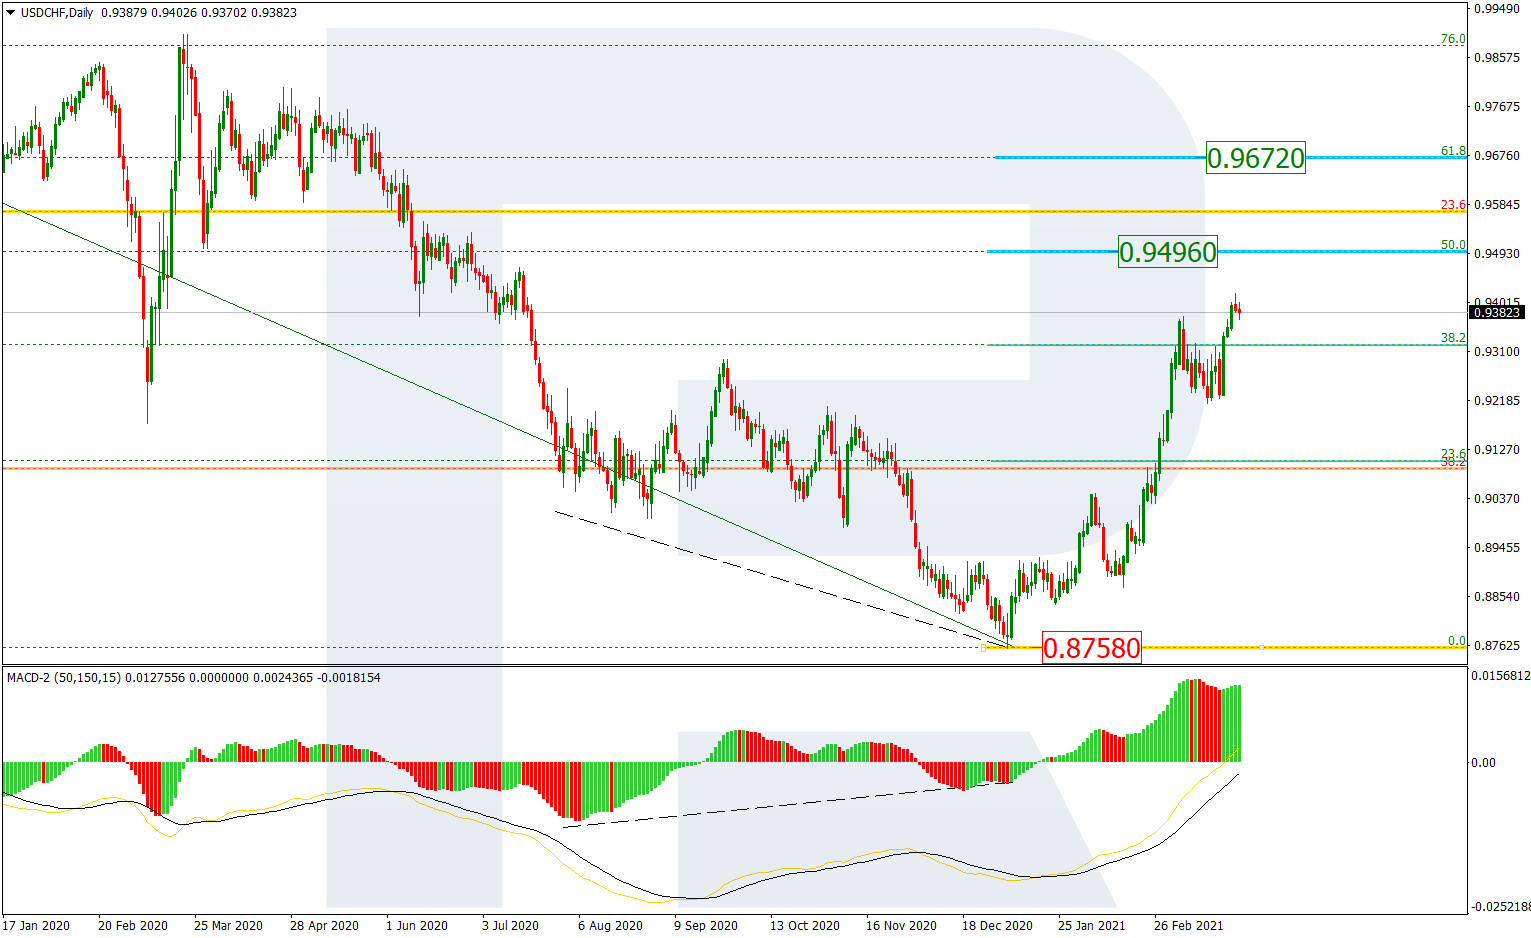
USDCHF, “US Dollar vs Swiss Franc”
The daily chart shows that a convergence made start a new rising wave, which has already broken 23.6% fibo and may later continue growing to reach 38.2% fibo at 0.9323. The key upside target is 50.0% fibo at 0.9496. However, if the asset breaks the support at 0.8758, the correction may be over.
As we can see in the H4 chart, after correcting by almost 50.0%, USDCHF has broken the high 0.9046 to enter the post-correctional extension area between 138.2% and 161.8% fibo at 0.9113 and 0.9154 respectively. the support is the local low at 0.8871.
