GBPUSD, “Great Britain Pound vs US Dollar”
As we can see in the H4 chart, the current growth is slowing down. This technical picture implies that the asset may start a new descending wave. The first downside target will be the low at 1.3572, a breakout of which may lead to a further downtrend towards the mid-term 38.2% fibo at 1.3419. On the other hand, the price may rebound from the low and resume trading upwards to reach 61.8% and 76.0% fibo at 1.3991 and 1.4087 respectively.


The H1 chart shows that after correcting upwards by 50.0%, the asset may continue growing to reach 61.8% fibo at 1.3838. At the same time, there is divergence on MACD may indicate a new short-term decline soon towards the local support at 1.3602.


EURJPY, “Euro vs. Japanese Yen”
In the H4 chart, the asset is correcting upwards after a test of 50.0% fibo at 127.87 and convergence on MACD. After the pullback is over, the pair may resume falling towards the mid-term 61.8% fibo at 126.40. The resistance is the high at 134.12.


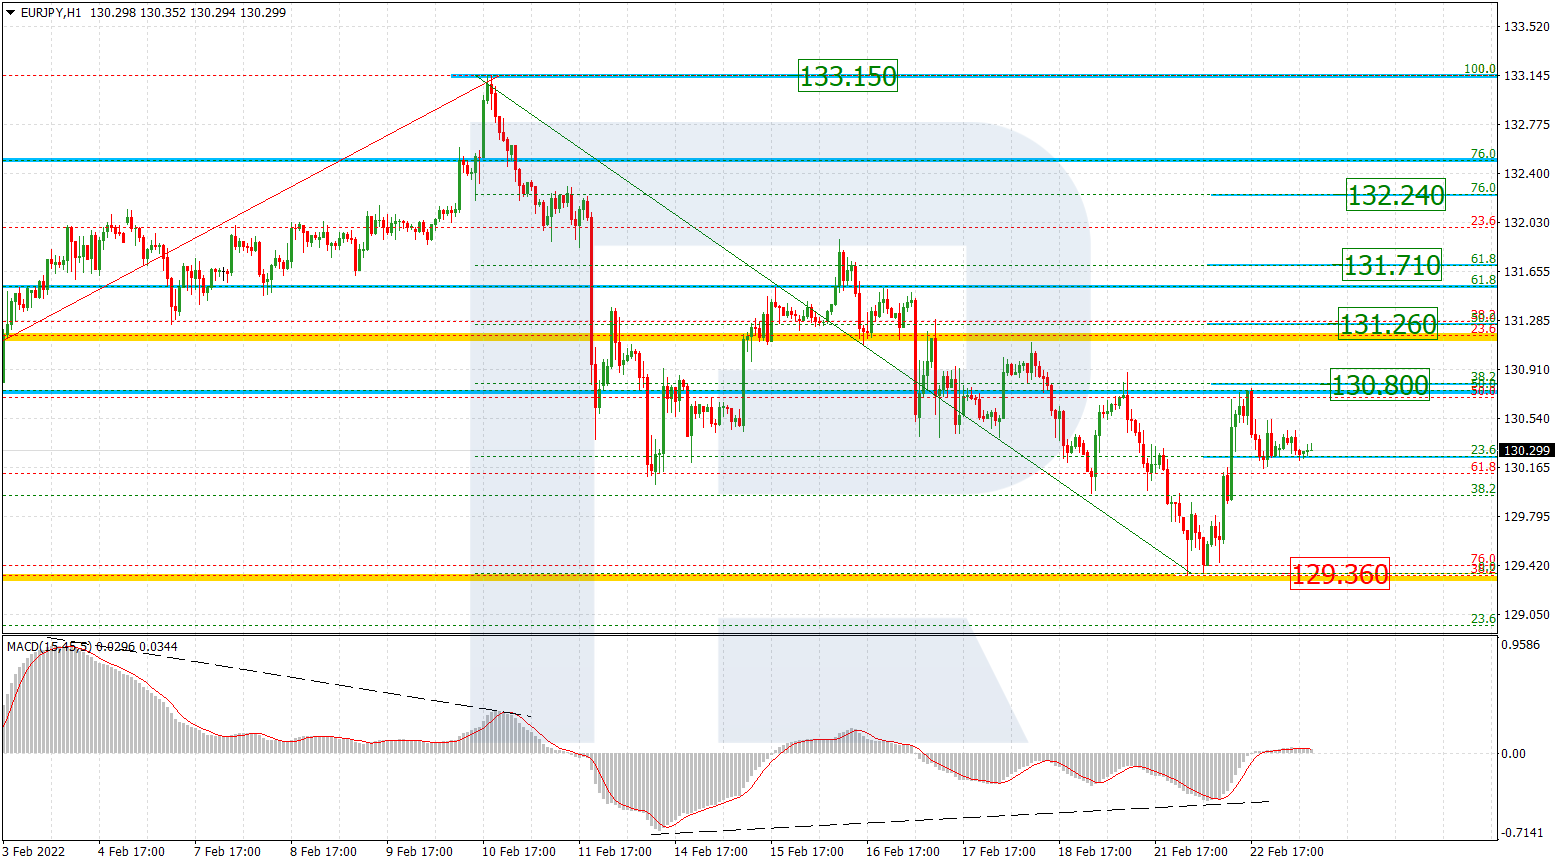
As we can see in the H1 chart, convergence on MACD made the asset start a new correctional uptrend towards 38.2% fibo at 130.29. The next upside target may be 50.0% fibo at 131.02. On the other hand, a breakout of the local low at 127.93 will lead to a further downtrend. Also, there might be divergence on MACD to indicate a new decline soon.

