BTCUSD, “Bitcoin vs US Dollar”
As we can see in the daily chart, after finishing the ascending impulse, BTCUSD is correcting. The impulse itself is a part of the mid-term correction that started after the convergence. By now, the impulse has already reached 38.2% fibo. Later, the market may complete the current local correction and resume growing towards 50.0% and 61.8% fibo at 10578.00 and 11345.00 respectively. the support is at 7302.00.


In the H1 chart, the pair is correcting downwards and has already reached 50.0% fibo. The next downside target may be 61.8% fibo at 8532.00. The resistance is the high at 10521.60.


ETHUSD, “Ethereum vs. US Dollar”
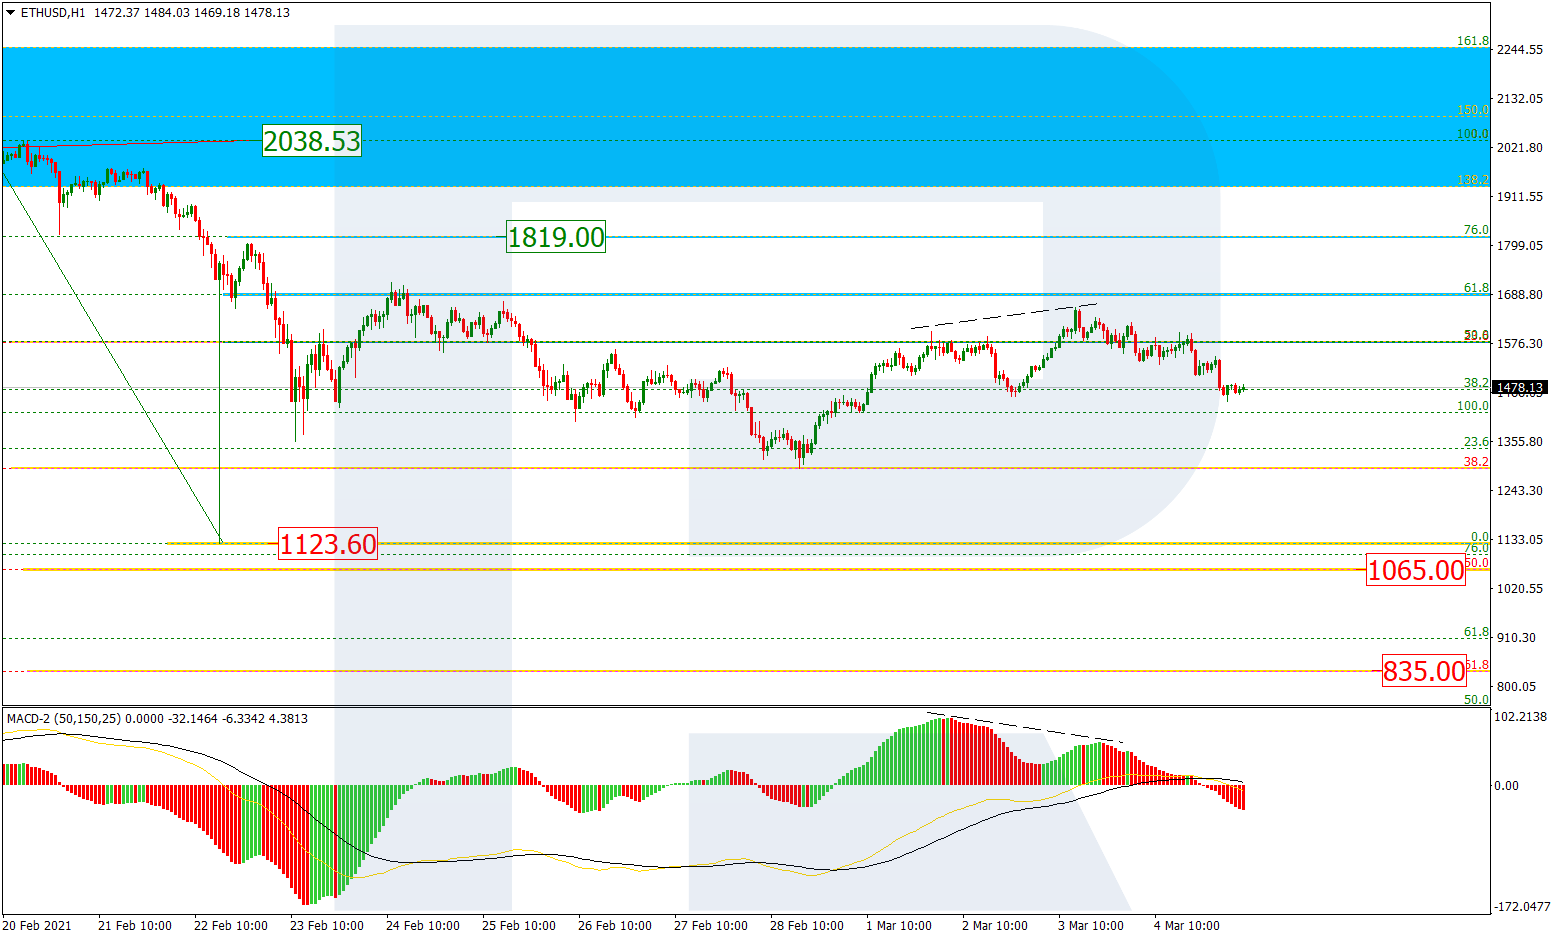
As we can see in the H4 chart, after falling and trying to test the low at 152.28, ETHUSD started a new rising impulse, which has already tested 61.8% fibo. The next upside target is 76.0% fibo at 207.04. however, if the price breaks the low, the instrument may continue falling towards 76.0% fibo at 148.60 and then the post-correctional extension area between 138.2% and 161.8% fibo at 135.30 and 124.40 respectively.


In the H1 chart, the instrument is correcting in the form of Triangle after completing the rising impulse and has already reached 50.0% fibo. The next target is 61.8% fibo at 170.60. The resistance is the local high at 198.94.

