Fibonacci Retracements Analysis 02.08.2019 (BITCOIN, ETHEREUM)
As we can see in the daily chart, BTCUSD is still testing 38.2% fibo. The nest downside targets may be 50.0% and 61.8% fibo at 8600.00 and 7370.00 respectively. The resistance is 23.6% fibo at 11375.00.
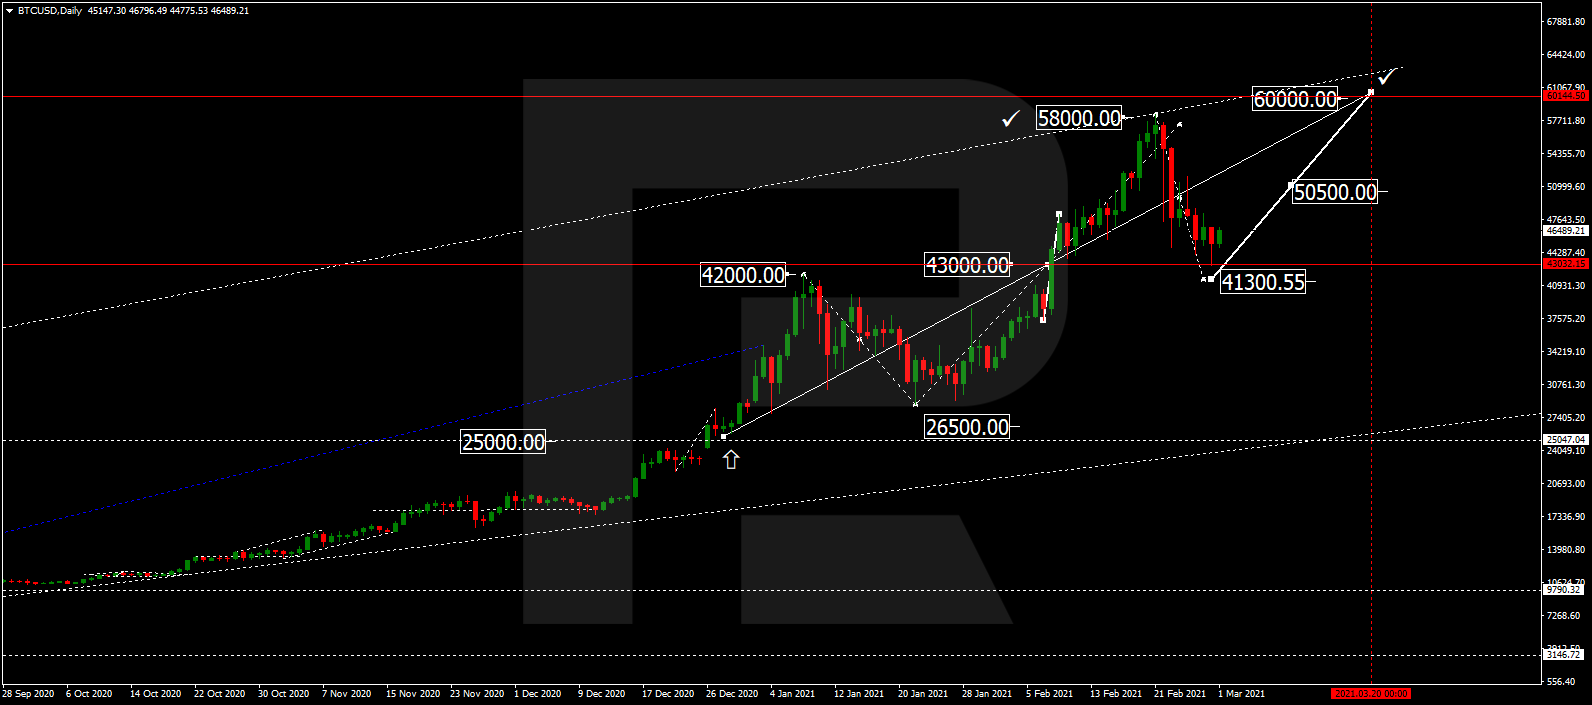

In the H4 chart, the pair is being corrected to the downside. The first correctional wave has almost reached 50.0% at 11145.00. The next wave may test this level and then grow towards 61.8% fibo at 11629.00. The support is the low at 9098.90.

ETHUSD, “Ethereum vs. US Dollar”
As we can see in the daily chart, ETHUSD is still being corrected between 50.0% and 61.8% fibo. After completing the correction, the pair may fall towards 76.0% fibo at 163.50. The resistance is 38.2% fibo at 262.80.
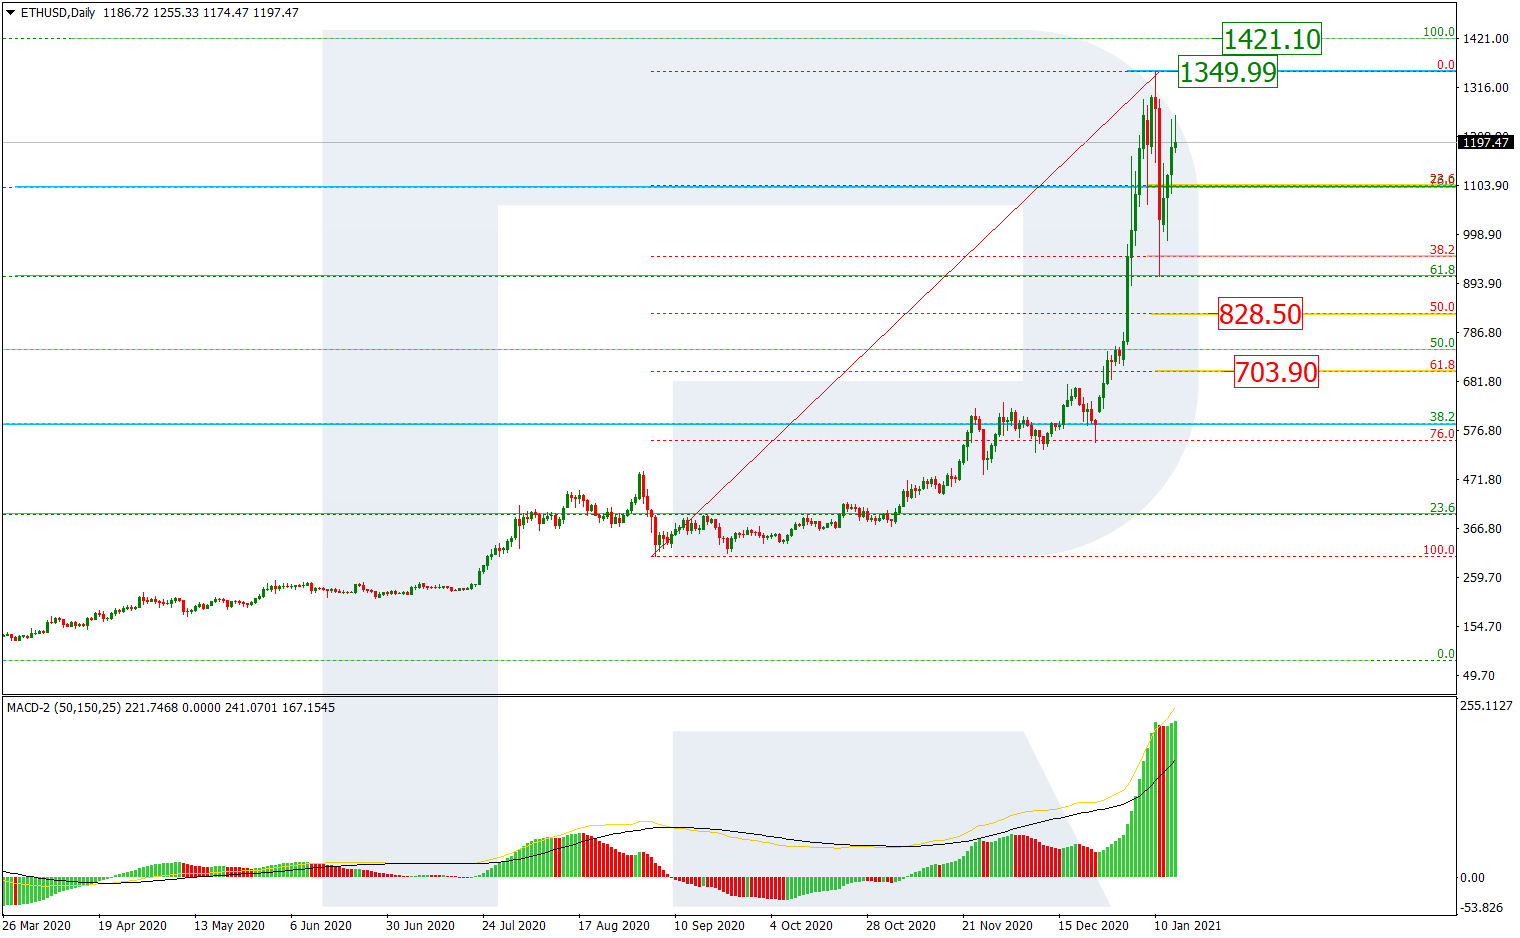
The H4 chart shows more detailed structure of the current correction. After testing 23.6% fibo for the second time, the pair may grow to reach 38.2% and 50.0% fibo at 239.45 and 254.30 respectively. If the price breaks the low at 190.41, the instrument may resume its mid-term decline.
