Brent
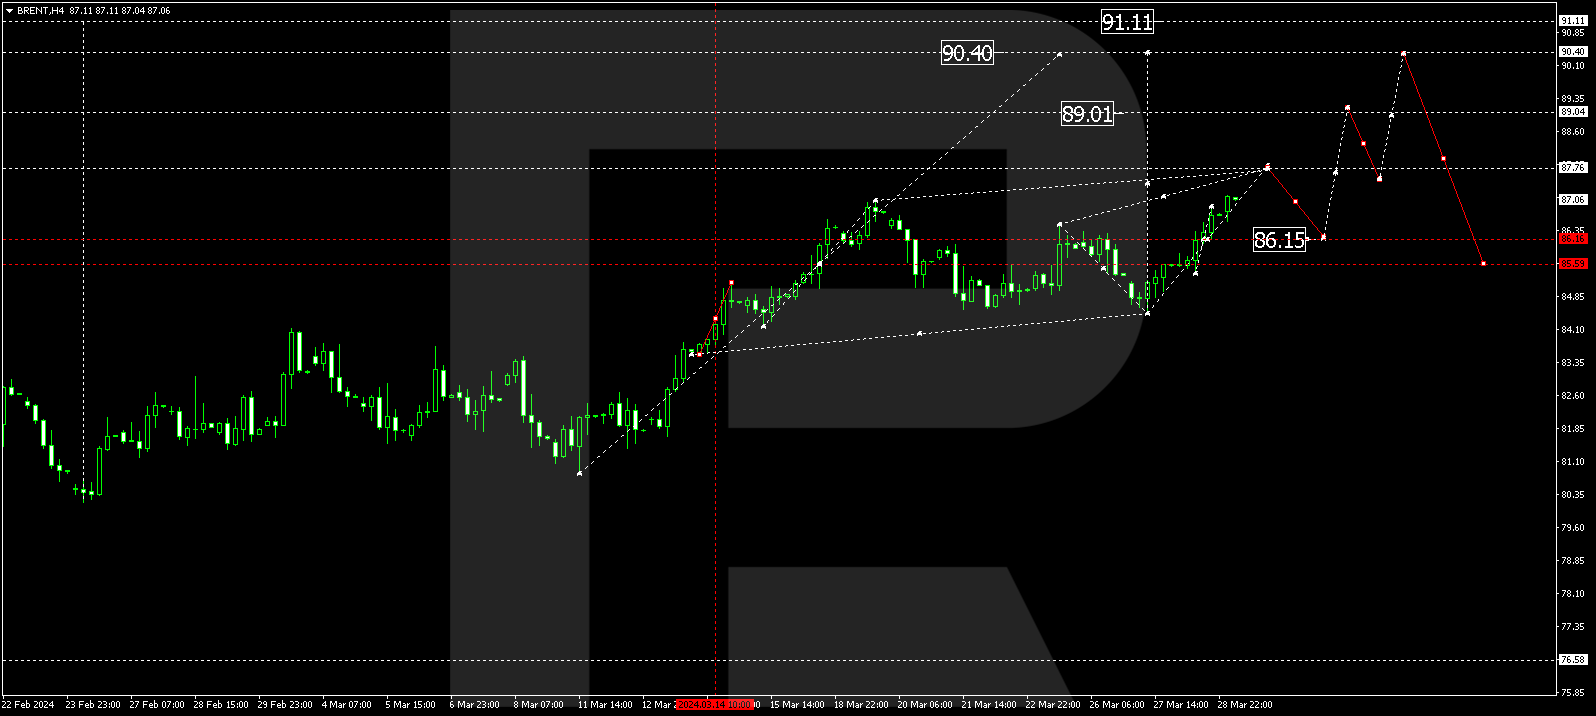
In the H4 chart, the correctional uptrend in Brent has reached 61.8% fib and may later continue towards 76.0% fibo at 74.50. After that, the instrument may start a new decline to break the low at 65.03 and reach the mid-term 23.6% fibo at 62.90. The resistance is still close to the high at 77.48.

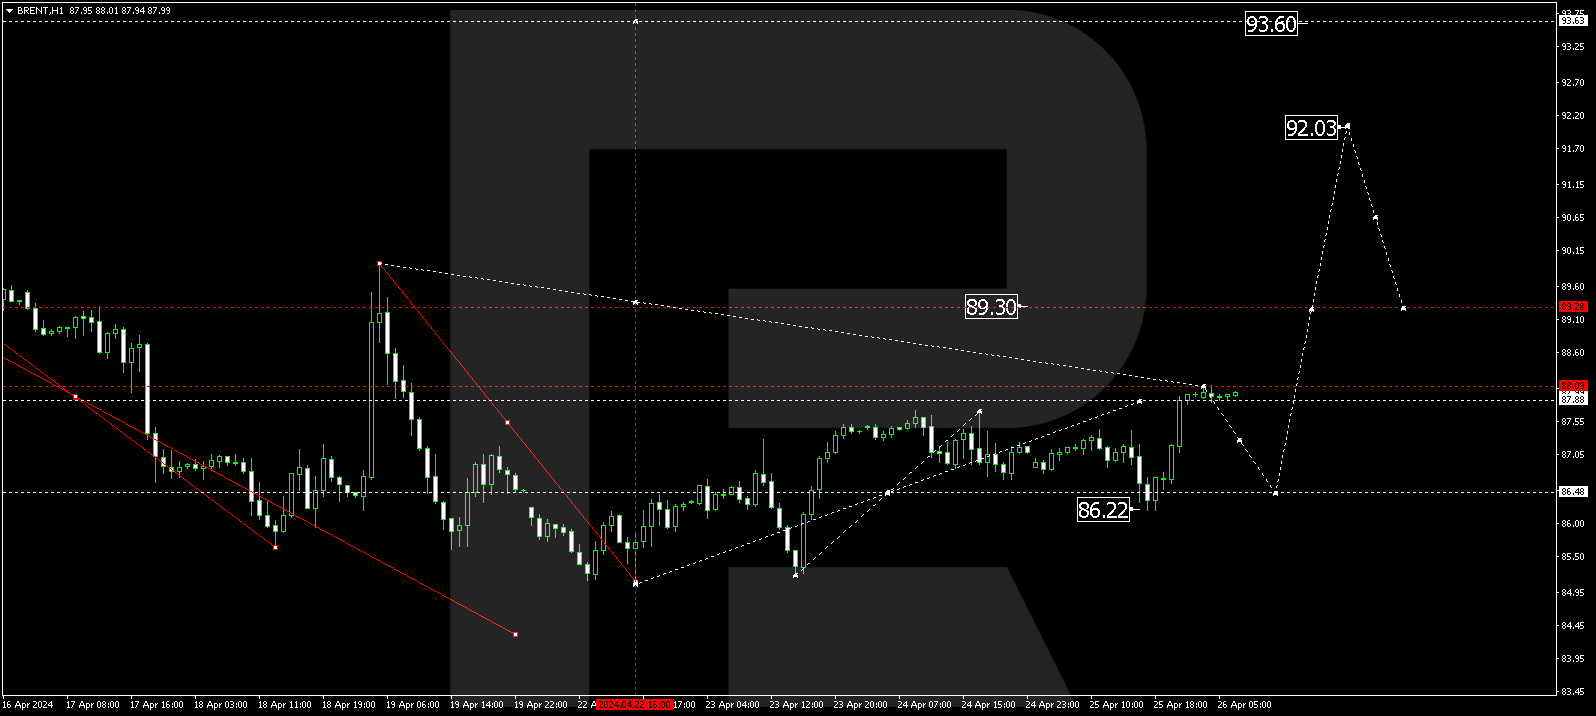
As we can see in the H1 chart, the first descending wave has tested 23.6% fibo after divergence on MACD. The next downside target may be 38.2%, 50.0%, 61.8%, and 76.0% fibo at 69.89, 68.95, 68.04, and 66.92 respectively. The local resistance is at 72.88.
Dow Jones
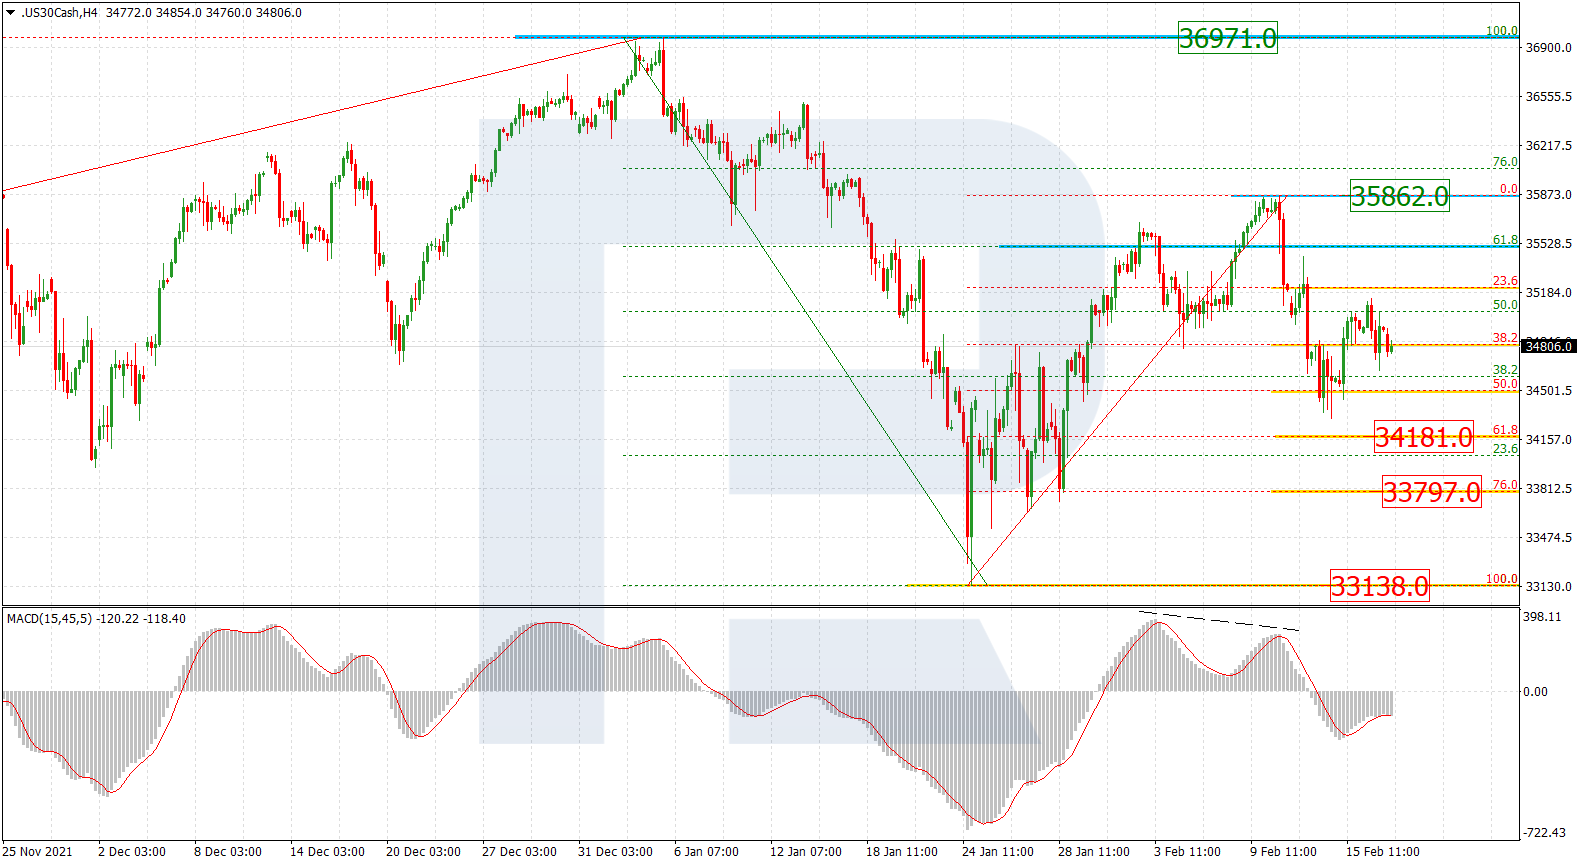
The H4 chart shows that the asset is moving close to its all-time high at 35631.0. This technical picture implies that the instrument may not be able to break the high and continue growing towards the post-correctional extension area between 138.2% and 161.8% fibo at 36035.0 and 36288.00 respectively. the main scenario suggests a new descending wave towards the low at 34569.0.
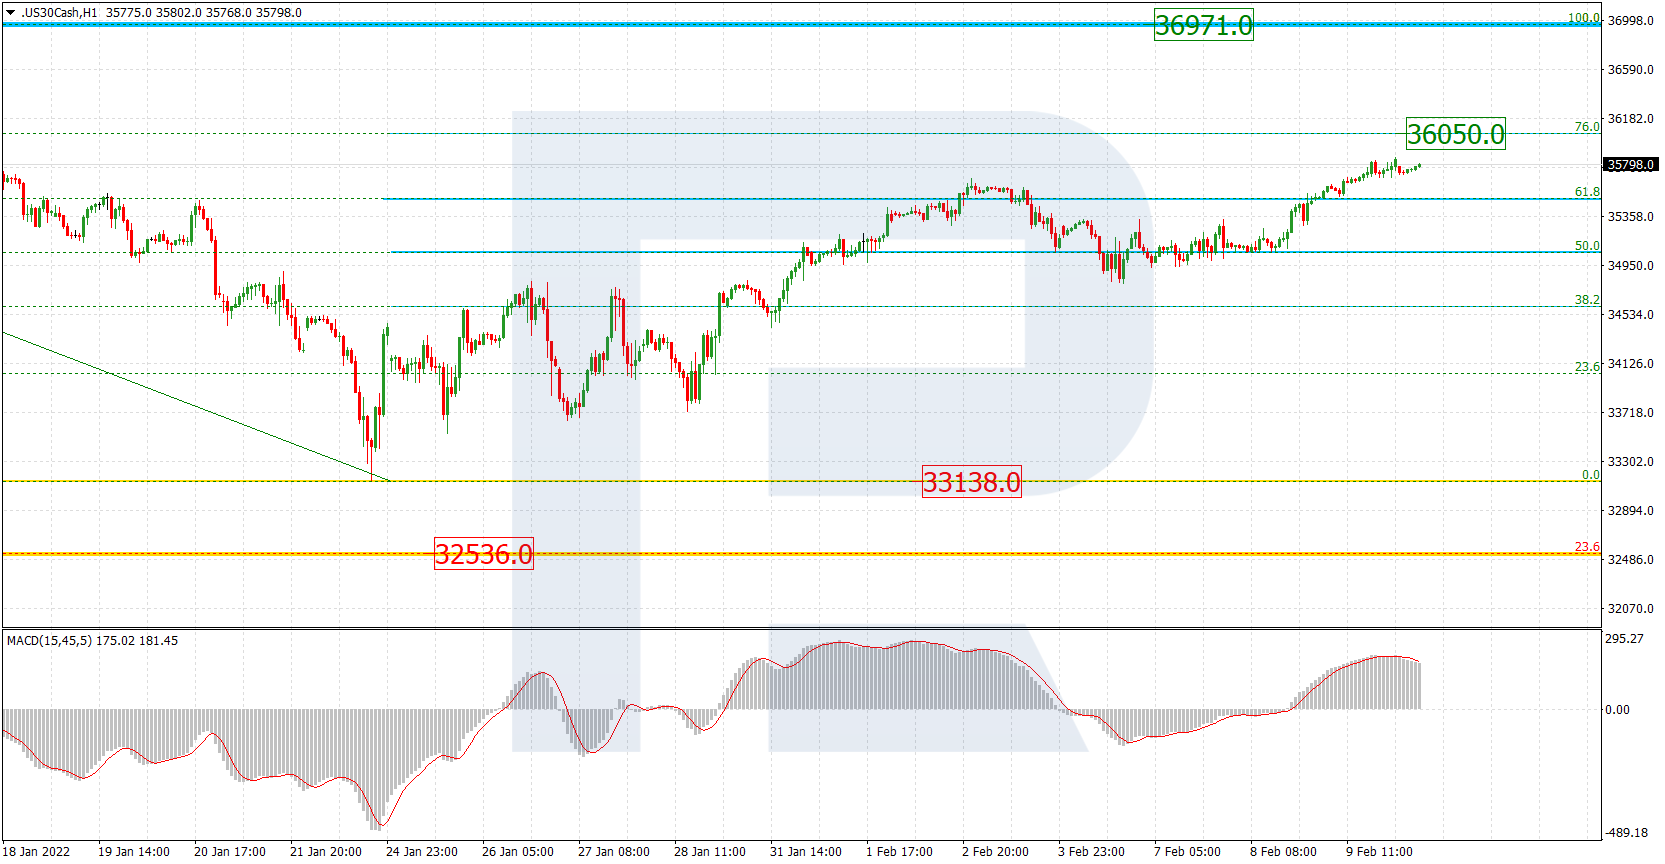
As we can see in the H1 chart, the first descending wave after divergence on MACD has reached 23.6%. in this case, the asset may continue falling towards 38.2%, 50.0%, 61.8%, and 76.0% fibo at 35151.5, 35041.9, 34930.0, and 34769.5 respectively. The local resistance is the high at 35513.0.