GBPUSD, “Great Britain Pound vs US Dollar”
As we can see in the H4 chart, after skyrocketing to 1.4241, GBPUSD is forming a mid-term descending pullback, which has already reached 23.6% fibo; right now, the pair is correcting. After completing this slight correction, the decline may continue to reach 38.2%, 50.0%, and 61.8% fibo at 1.3642, 1.3459, and 1.3273 respectively. A breakout of the high will result in a further uptrend towards the long-term fractal high at 1.4376.


The H1 chart shows that the short-term correctional ascending impulse has reached 23.5% after a convergence and may later continue towards 38.2% and 50.0% fibo at 1.4005 and 1.4050 respectively. A breakout of the low at 1.3859 will result in a further mid-term downtrend.

EURJPY, “Euro vs. Japanese Yen”
As we can see in the H4 chart, after breaking 61.8% fibo at 128.68 and then testing the post-correctional extension area between 138.2% and 161.8% fibo at 129.16 and 130.43 respectively, EURJPY has formed a pullback. At the moment, the pair is resuming its growth towards the above-mentioned area and may later continue the uptrend to reach 76.0% at 131.95.

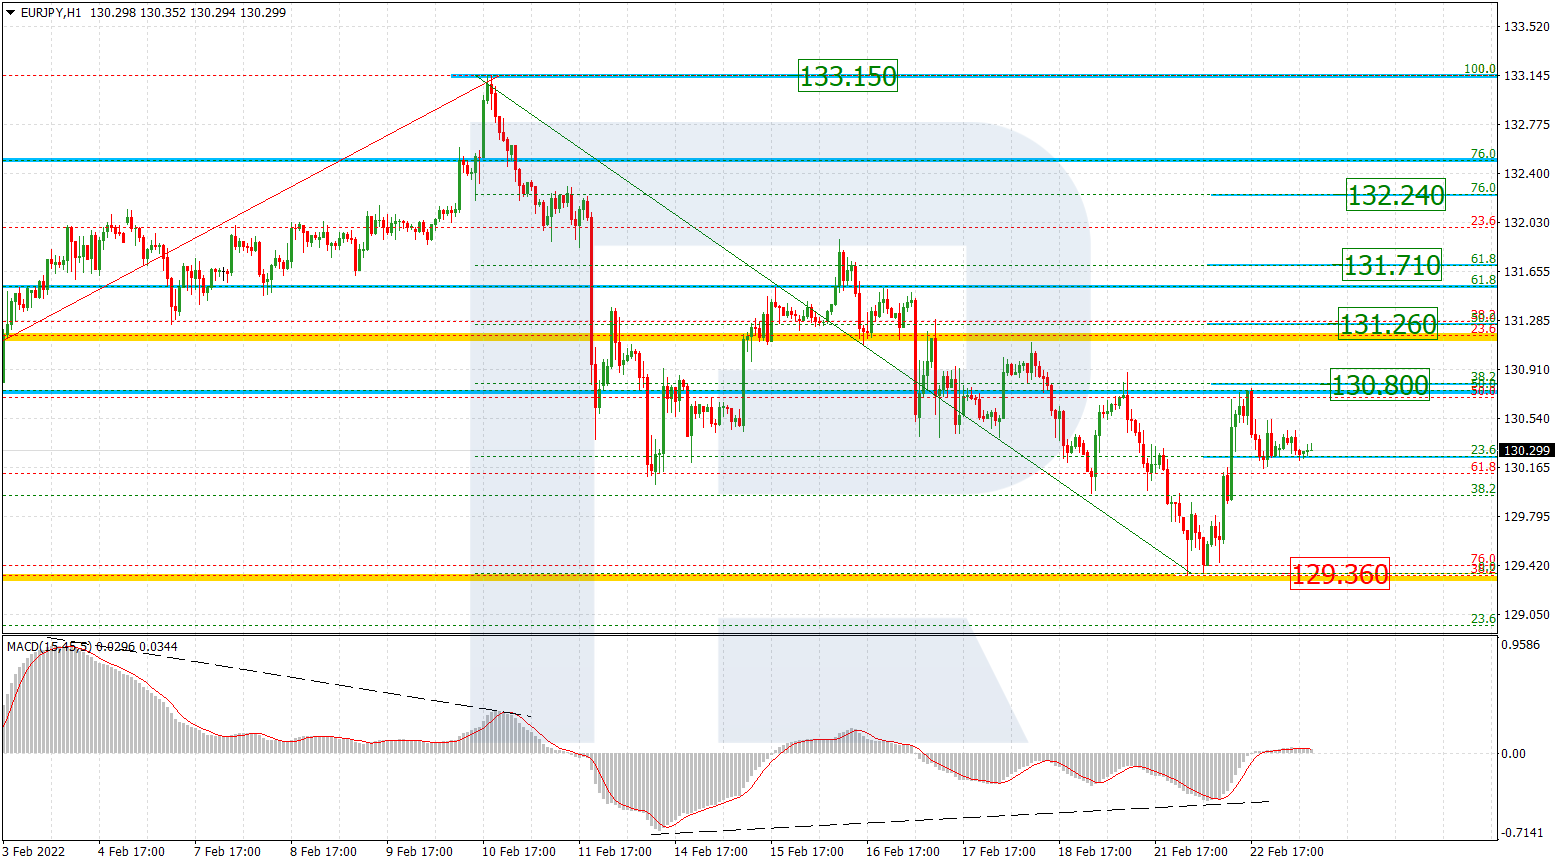
In the H1 chart, the correctional downtrend has failed to reach 38.2% fibo at 128.10, meaning that the current growth is just a slight short-term pullback, which may be followed by another descending wave. A further downtrend may be heading towards 50.0% and 61.8% fibo at 127.53 and 126.95 respectively.