GBPUSD, “Great Britain Pound vs US Dollar”
As we see in the H4 chart, GBPUSD is moving towards the high at 1.2648. After breaking it, the pair may continue growing towards the next target, which is mid-term 50.0% fibo at 1.2892. However, there is another scenario, according to which the price may rebound from the high and form one more descending wave to reach 50.0% fibo at 1.2030 but it’s highly unlikely.


The H1 chart shows a more detailed structure of the current ascending correction, which, after breaking 76.0% fibo, has almost reached the high. At the same time, there might be a divergence on MACD to indicate a pullback in the nearest future. The target of this pullback may be the local support at 61.8% (1.2425).

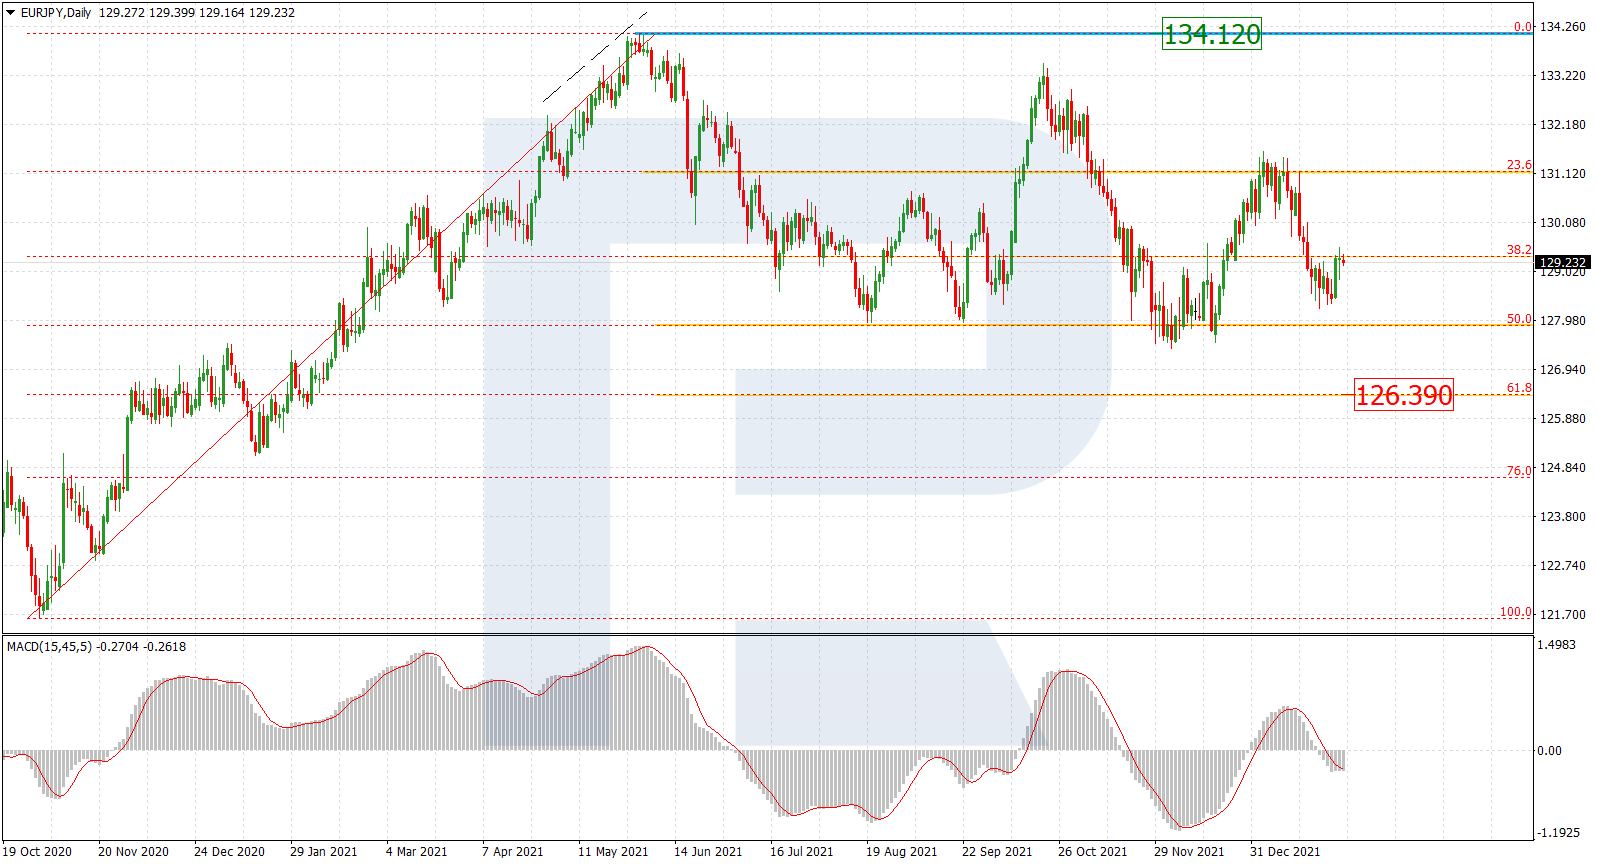
EURJPY, “Euro vs. Japanese Yen”
As we can see in the daily chart, the convergence of MACD made EURJPY start a new rising movement, which may be considered as a reversal and long-term wave. The pair has already broken 23.6% fibo and may continue growing towards 38.2% and 50.0% fibo at 123.22 and 125.93 respectively. The support is the low at 114.40.
The H4 chart shows that after breaking 76.0% fibo, the instrument may continue trading to reach the high at 122.87.
