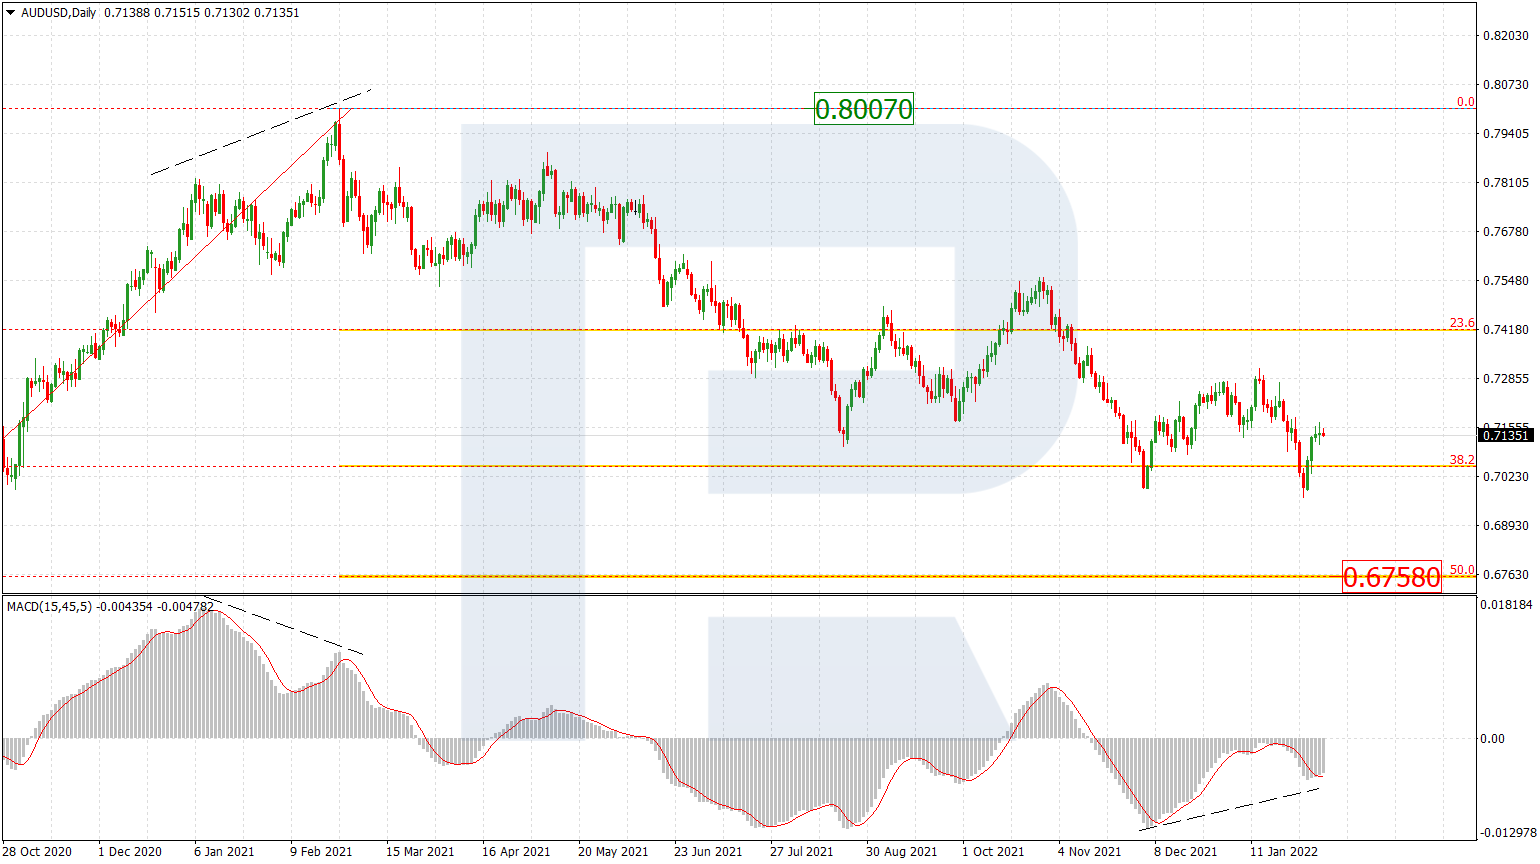
AUDUSD, “Australian Dollar vs US Dollar”
In the daily chart, after attempting to test 38.2% fibo at 0.7052, the asset is correcting upwards to return to 23.6% fibo. After the pullback is over, the asset may continue falling towards 50.0% and 61.8% fibo at 0.6758 and 0.6464 respectively. The key resistance is the high at 0.8007.

The H4 chart of AUDUSD shows that the correctional uptrend has reached 38.2% fibo and may later continue towards and 50.0% and 61.8% fibo at 0.7498 and 0.7591 respectively. A breakout of the local support at 0.7106 will lead to a further mid-term downtrend with the closest target at 38.2% fibo (0.7052).

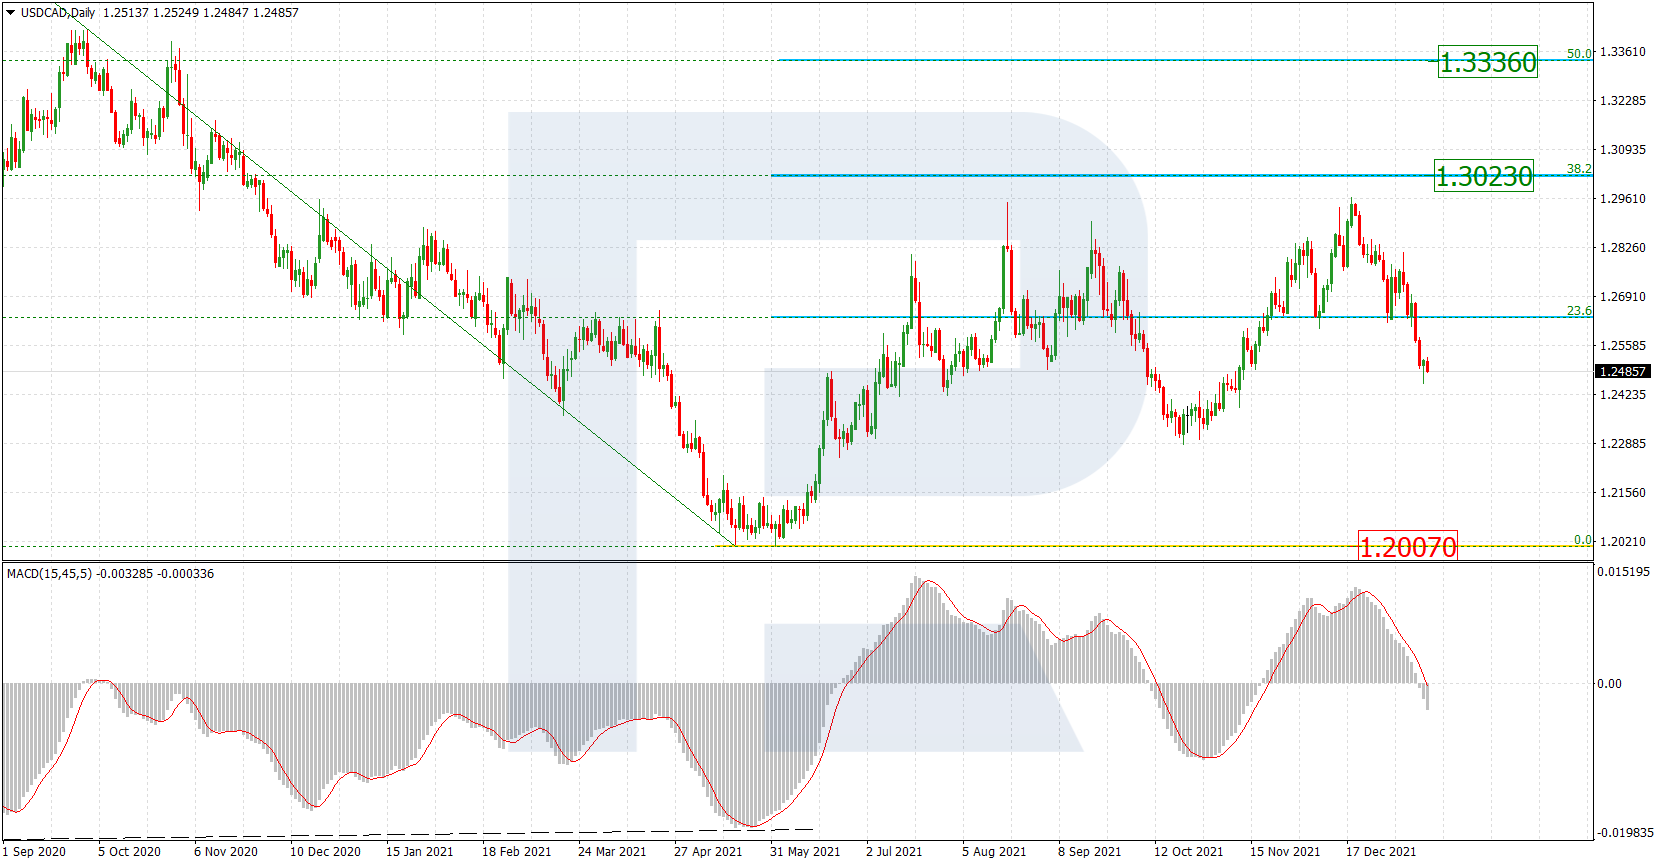
USDCAD, “US Dollar vs Canadian Dollar”
As we can see in the daily chart, after an attempt to reach 38.2% fibo at 1.3022 and local divergence on MACD, the pair is correcting downwards. After finishing the pullback and breaking 38.2% fibo, the asset may form a new wave to the upside with the targets at 50.0% and 61.8% fibo at 1.3336 and 1.3650 respectively. The key support remains at the low at 1.2007.
The H4 chart shows that after a thorough test of 38.2% fibo, the asset has broken this level; right now, it is forming a new descending impulse towards 50.0%, 61.8%, and 76.0% fibo at 1.2478, 1.2366, and 1.2234 respectively. The local resistance is the fractal high at 1.2949.
