EURUSD, “Euro vs US Dollar”
As we can see in the H4 chart, the convergence made the pair start a short-term descending correction =, which has reached 23.6% fibo. At the moment, EURUSD is forming another rising wave towards 61.8% and 76.0% fibo at 1.1208 and 1.1248 respectively.


In the H1 chart, the convergence on MACD made the pair start a new rising wave, which has reached 50.0% fibo. In the nearest future, the price may form a pullback towards 1.1056, which may later be followed by further growth to reach 61.8% and 76.0% fibo at 1.1103 and 1.1131 respectively, and then the high at 1.1179. The support is the low at 1.0981.

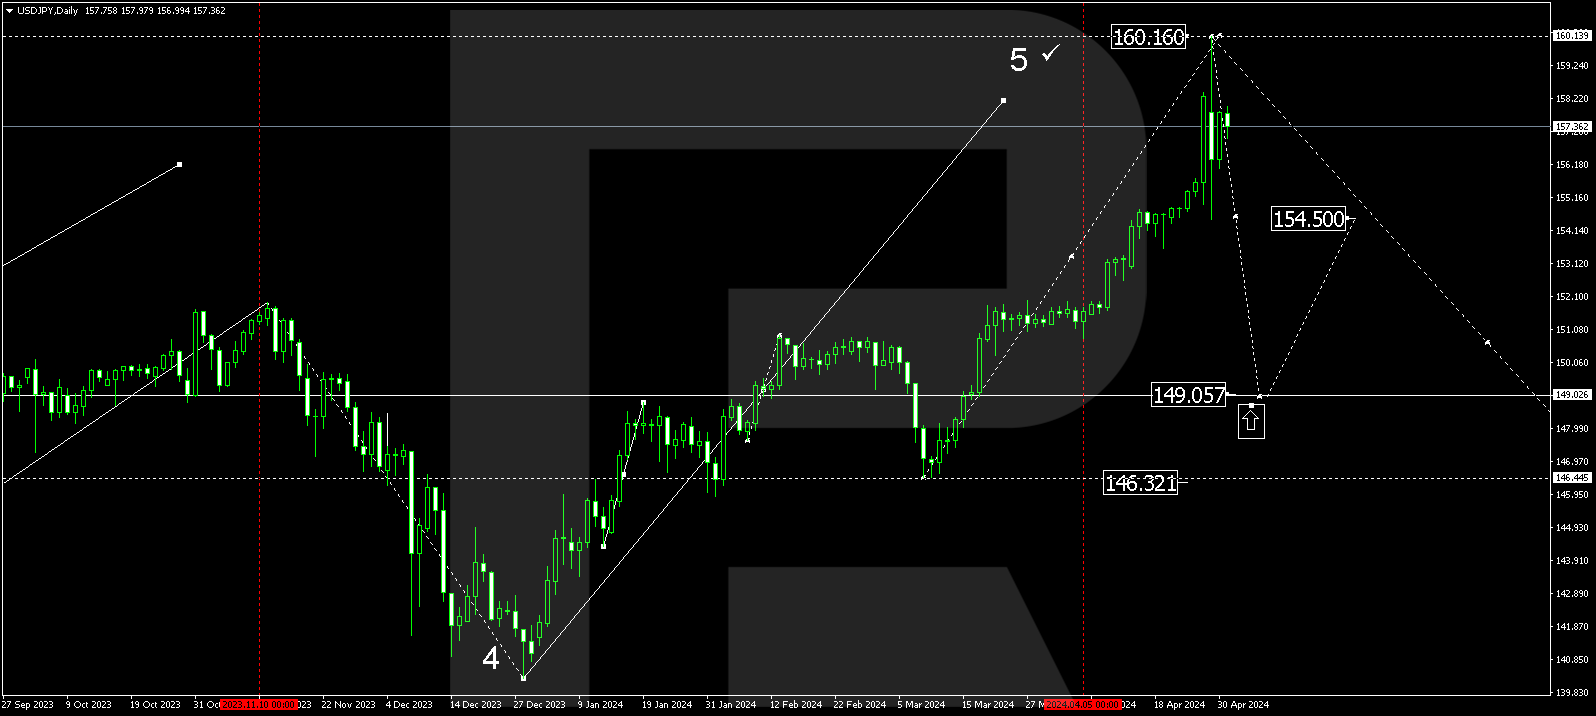
USDJPY, “US Dollar vs. Japanese Yen”
As we can see in the daily chart, the divergence made the pair stop at mid-term 61.8% fibo and reverse downwards. USDJPY may yet continue moving upwards to reach 76.0% fibo at 110.49, but the main scenario implies a reverse and a new decline. To confirm the reverse, the instrument must break 50.0% fibo.
The H4 chart shows more detailed structure of the current descending tendency. The downside targets are 23.6%, 38.2%, and 50.0% fibo at 108.48, 107.71, and 107.09 respectively. However, if the price breaks the high at 109.73, the instrument may continue the mid-term uptrend.
