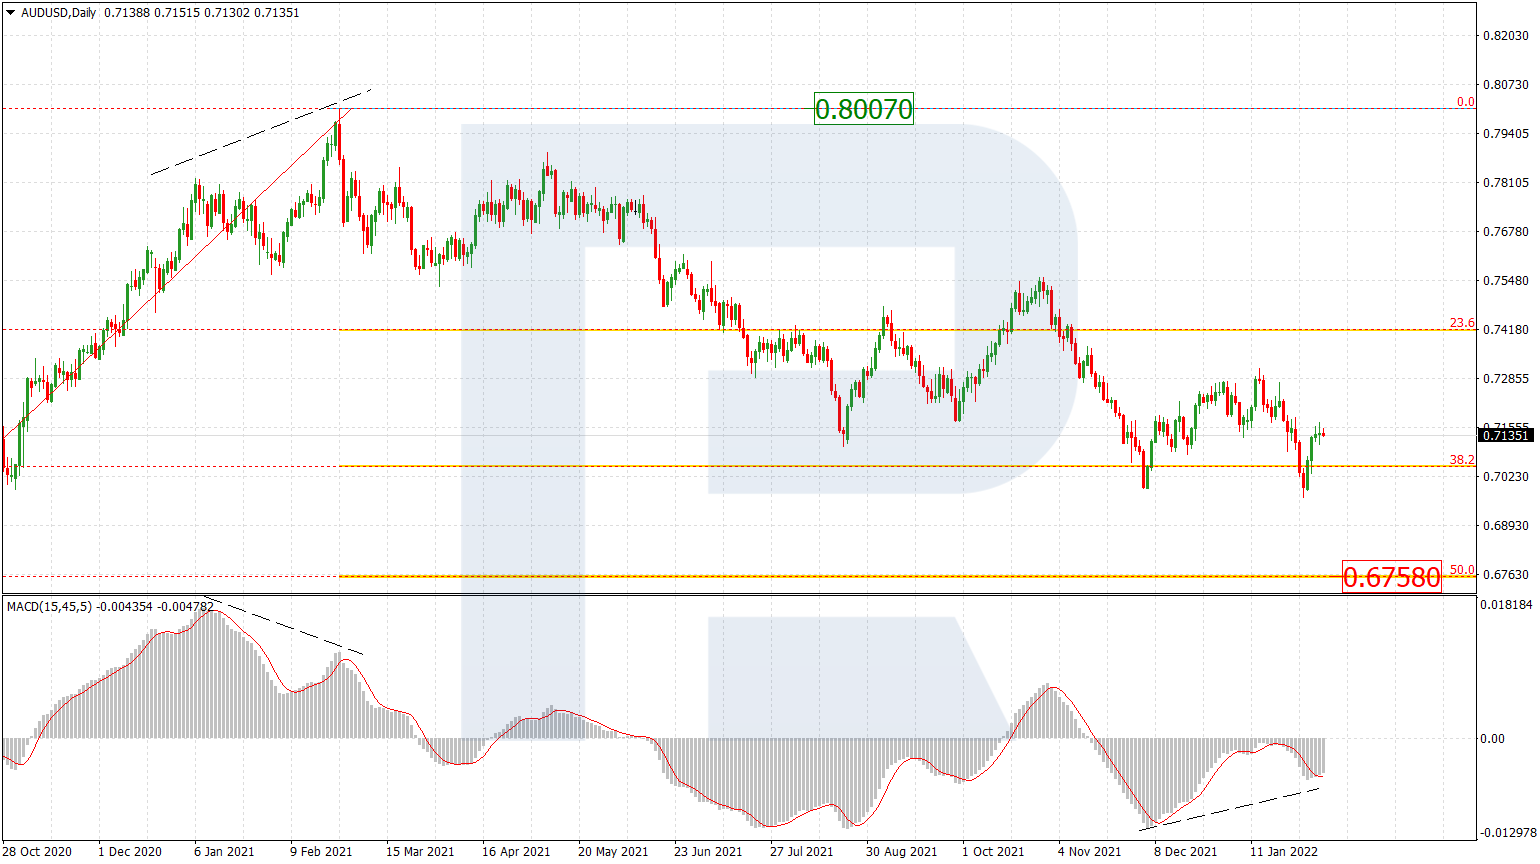
AUDUSD, “Australian Dollar vs US Dollar”
As we can see in the daily chart, after breaking 38.2% fibo, the asset has failed to reach 50.0% fibo at 0.8292. Right now, there is a divergence on MACD, which indicates that the pair is about to start a new pullback towards the support at 23.6% fibo (0.6820). After the pullback is over, the instrument may form a new rising impulse to reach 50.0% and 61.8% fibo at 0.8292 and 0.8946 respectively.

The H4 chart shows that a quick descending wave after the price reached the post-correctional extension area between 138.2% and 161.8% fibo at 0.7918 and 0.7978 respectively. The first descending wave has managed to reach and test 23.6% fibo, while the next one may continue towards 38.2%, 50.0%, and 61.8% fibo at 0.7619, 0.7500, and 0.7379 respectively.

USDCAD, “US Dollar vs Canadian Dollar”
The H4 chart shows that after attempting to enter the post-correctional extension area between 138.2% and 161.8% fibo at 1.2477 and 1.2409 respectively, the asset has rebounded very quickly. This growth may be considered as the start of a new correction. The local upside target is at 1.2881, while the key ones are 23.6% and 38.2% fibo at 1.2987 and 1.3310 respectively.

As we can see in the H1 chart, the pair is correcting downwards after finishing the ascending impulse, which, in its turn, was a correction of the previous decline. After completing the pullback, the instrument may resume trading upwards to reach 76.0% fibo at 1.2782 and then the fractal high at 1.2881.
