BTCUSD, “Bitcoin vs US Dollar”
As we can see in the H4 chart, the convergence made the pair complete a quick descending impulse and form a new correction. After reaching 23.6% fibo, the price started a pullback. Which may later be followed by further correction to the upside towards 38.2% and 50.0% fibo at 8747.00 and 9075.00 respectively. If the price breaks the low at 7675.00, BTCUSD will continue falling to reach the mid-term correctional target, 61.8% fibo at 7350.00.


In the H1 chart, the current pullback has reached 61.8% fibo. In this case, the price is expected to start a new rising wave towards the high at 8530.70.


ETHUSD, “Ethereum vs. US Dollar”
As we can see in the H4 chart, ETHUSD has completed the ascending correction close to 50.0% fibo at 188.40. After breaking the low at 152.28, the instrument may start a new descending wave towards the post-correctional extension area between 138.2% and 161.8% fibo at 140.40 and 125.85 respectively.


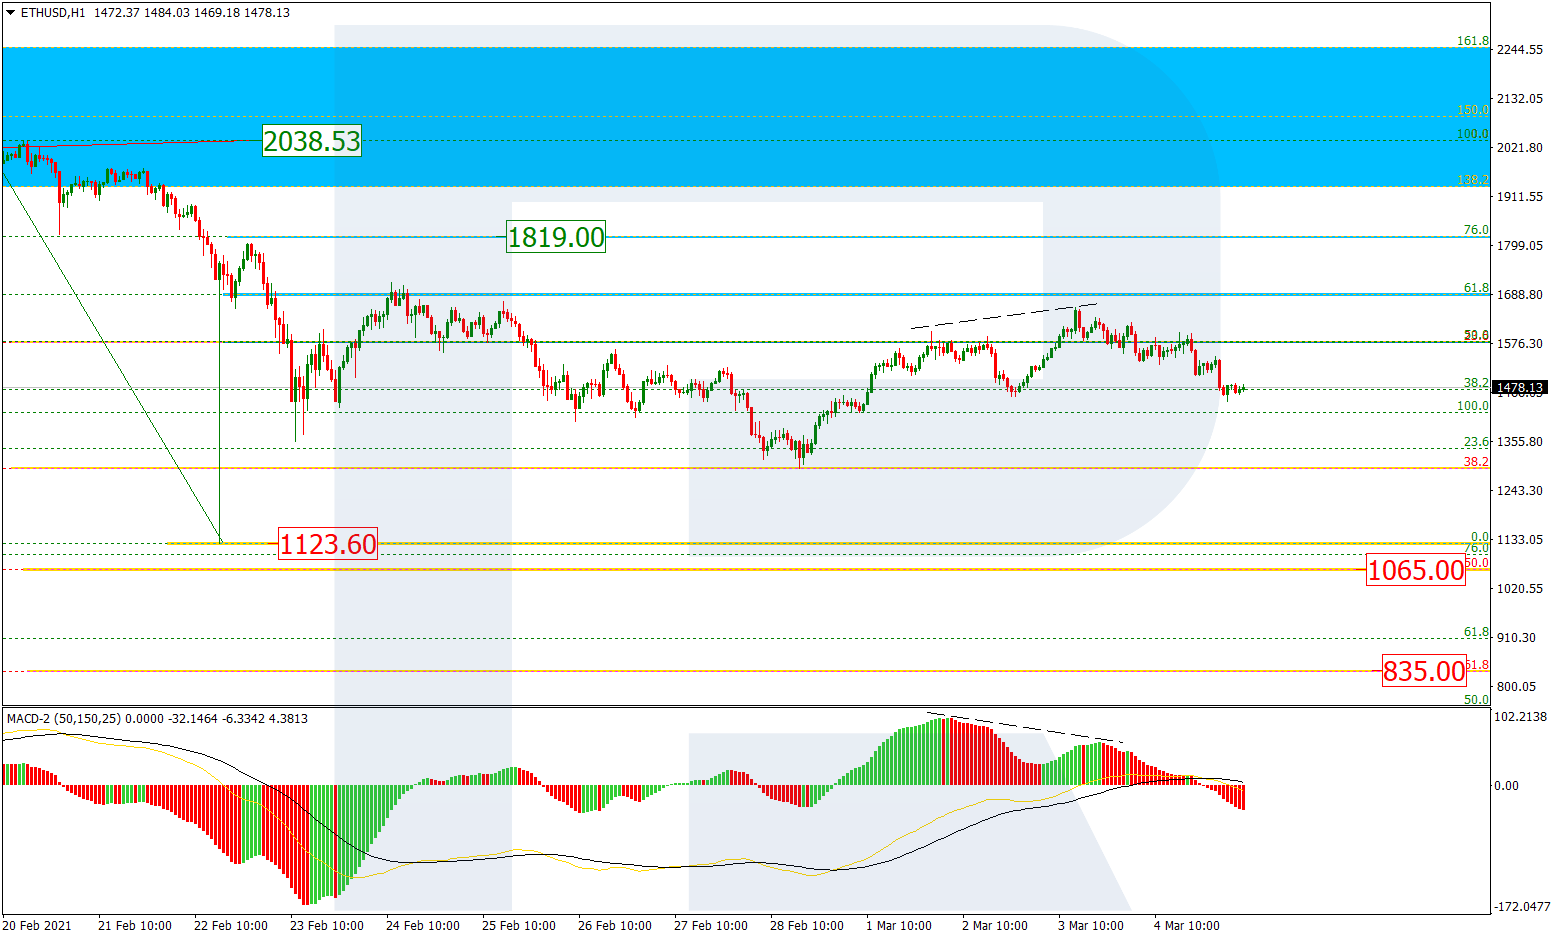
In the H1 chart, the divergence on MACD made the pair start a new decline, which is getting close to 50.0% fibo at 169.00 and even 61.8% fibo at 165.08. If the price breaks the high at 185.78, the correction may yet continue.

