GBPUSD, “Great Britain Pound vs US Dollar”
As we can see in the H4 chart, after the price had reached the retracement of 76.0%, there was a convergence on MACD, which made the pair start a new short-term correction within the downtrend. By now, the correction has already reached the retracement of 23.6%. In case it continues, the price may reach the retracements of 38.2% and 50.0% at 1.2795 and 1.2867 respectively. The support is the local low at 1.2558.


The H1 chart shows a stable correctional uptrend towards the retracement of 38.2% at 1.2795.

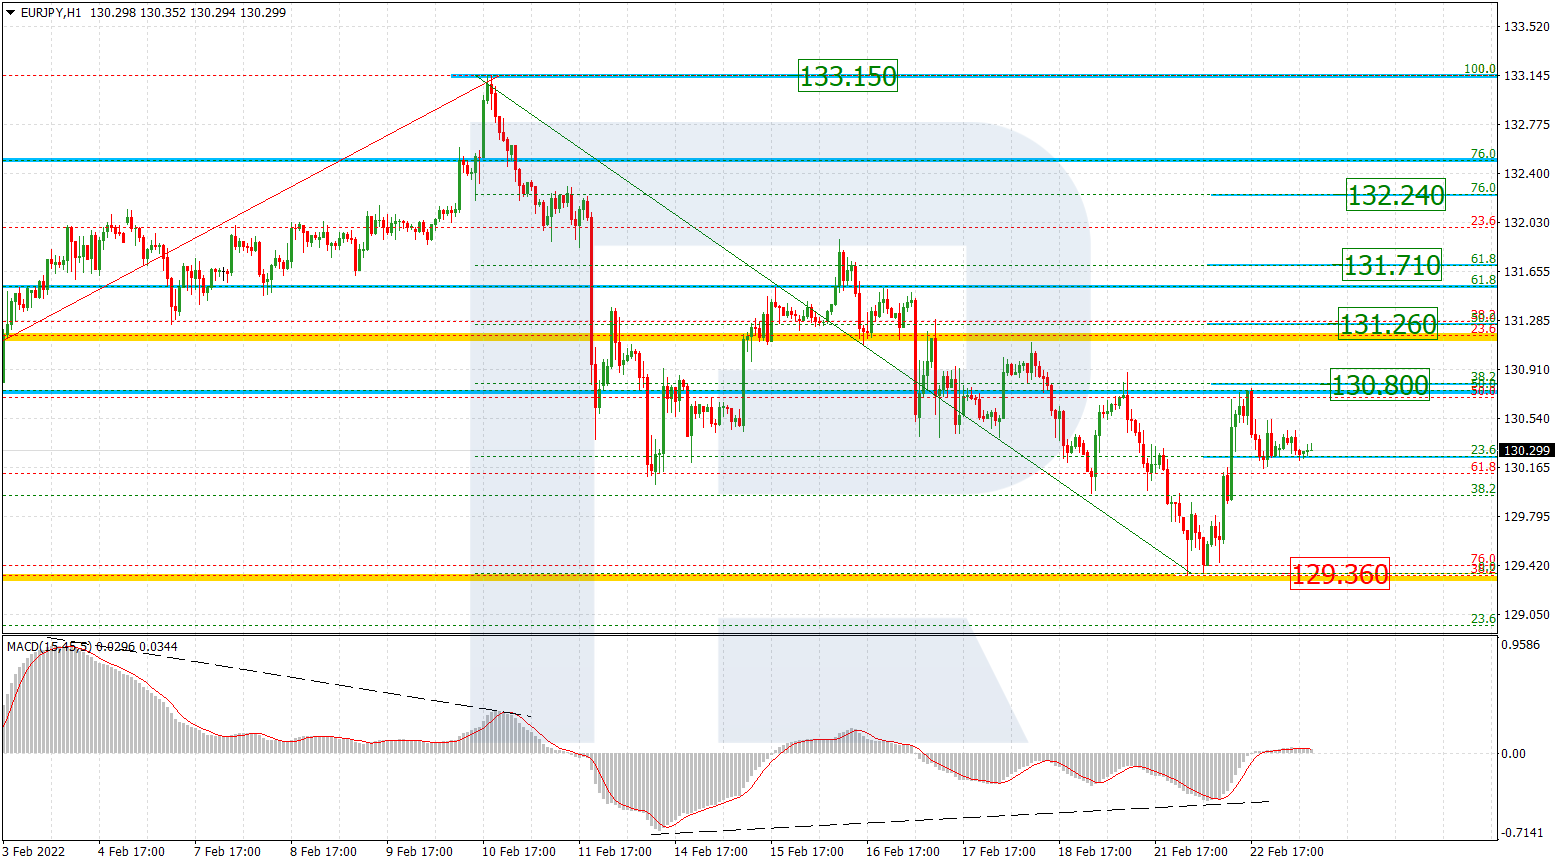
EURJPY, “Euro vs. Japanese Yen”
As we can see in the H4 chart, EURJPY is trading downwards and, after breaking the retracement of 61.8%, hasn’t been able to reach 120.25. At the same time, there is a convergence on MACD, which may indicate a new pullback. The resistance level is the retracement of 38.2% at 123.84. After finishing the pullback, the instrument may form a new descending structure to reach the retracement of 76.0% at 120.25 and then the low at 117.96

In the H1 chart, the pair is forming a short-term correction to the upside. Right now, the price is getting closer to the retracement of 38.2% at 121.91. After that, the instrument may reach the retracement of 50.0% at 122.26. The support is the low at 120.78.