GBPUSD, “Great Britain Pound vs US Dollar”
As we can see in the H4 chart, the ascending tendency continues. After breaking the long-term 50.0% fibo and entering the post-correctional extension area between 138.2% and 161.8% fibo at 1.3026 and 1.3158 respectively, the pair forming a new short-term pullback. The support is at 1.2813. The next rising impulse may be heading towards the long-term 61.8% fibo at 1.3243.


In the H1 chart, the divergence on MACD made the price start a new correction, which has already reached 23.6% fibo. The next correctional targets may be 38.2% and 50.0% fibo at 1.2918, and 1.2184 respectively. However, if the price breaks the high at 1.3170, the instrument may continue the uptrend.

EURJPY, “Euro vs. Japanese Yen”
As we can see in the H4 chart, after completing a short-term pullback, EURJPY stared a new rising impulse, which has already broken the high at 124.43 and may continue moving towards the long-term 50.0% fibo at 125.94 and then the post-correctional extension area between 138.2% and 161.8% fibo at 126.38 and 127.57 respectively. The support is the fractal low at 119.31.

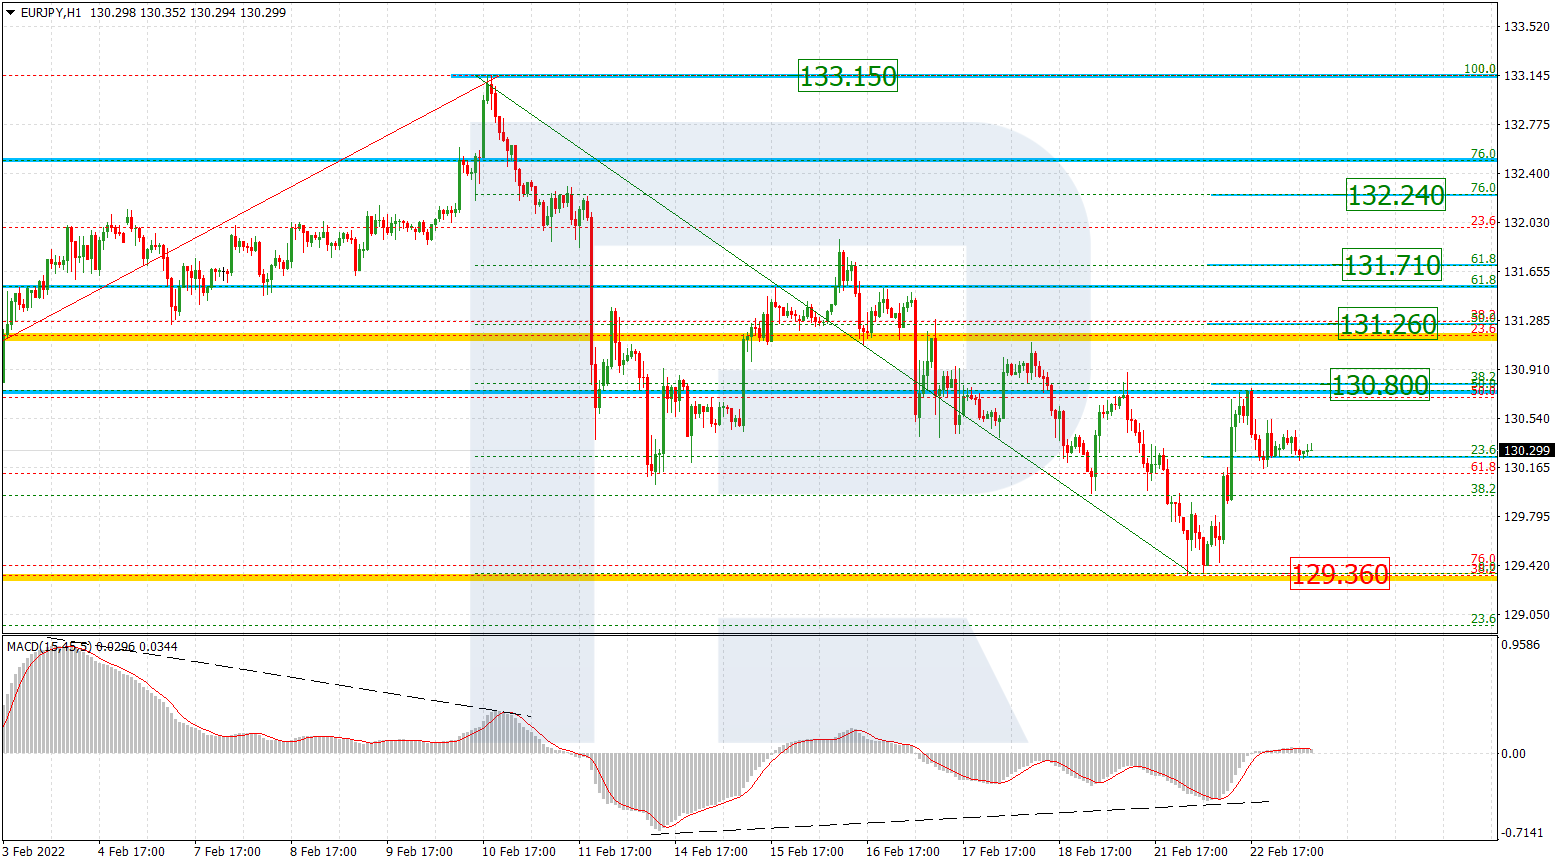
In the H1 chart, the instrument is correcting in the form of a Triangle after a local divergence on MACD. The first descending wave has already reached 23.6% fibo, while the next one can be heading towards 38.2% and 50.0% fibo at 123.33 and 122.74. A signal that the correction is over will be a breakout of the high at 125.21.