BTCUSD, “Bitcoin vs US Dollar”
As we can see in the H4 chart, after reaching the retracement of 50.0%, BTCUSD has started consolidating in the form of the Triangle pattern. If the instrument breaks this pattern to the upside, the price may grow to reach the retracements of 61.8% and 76.0% at 6911.00 and 7093.00 respectively; if to the downside – trade downwards to test the low at 6102.20.


In the H1 chart, the pair is trading between the support and resistance levels at 6411.10 and 6755.65 respectively.


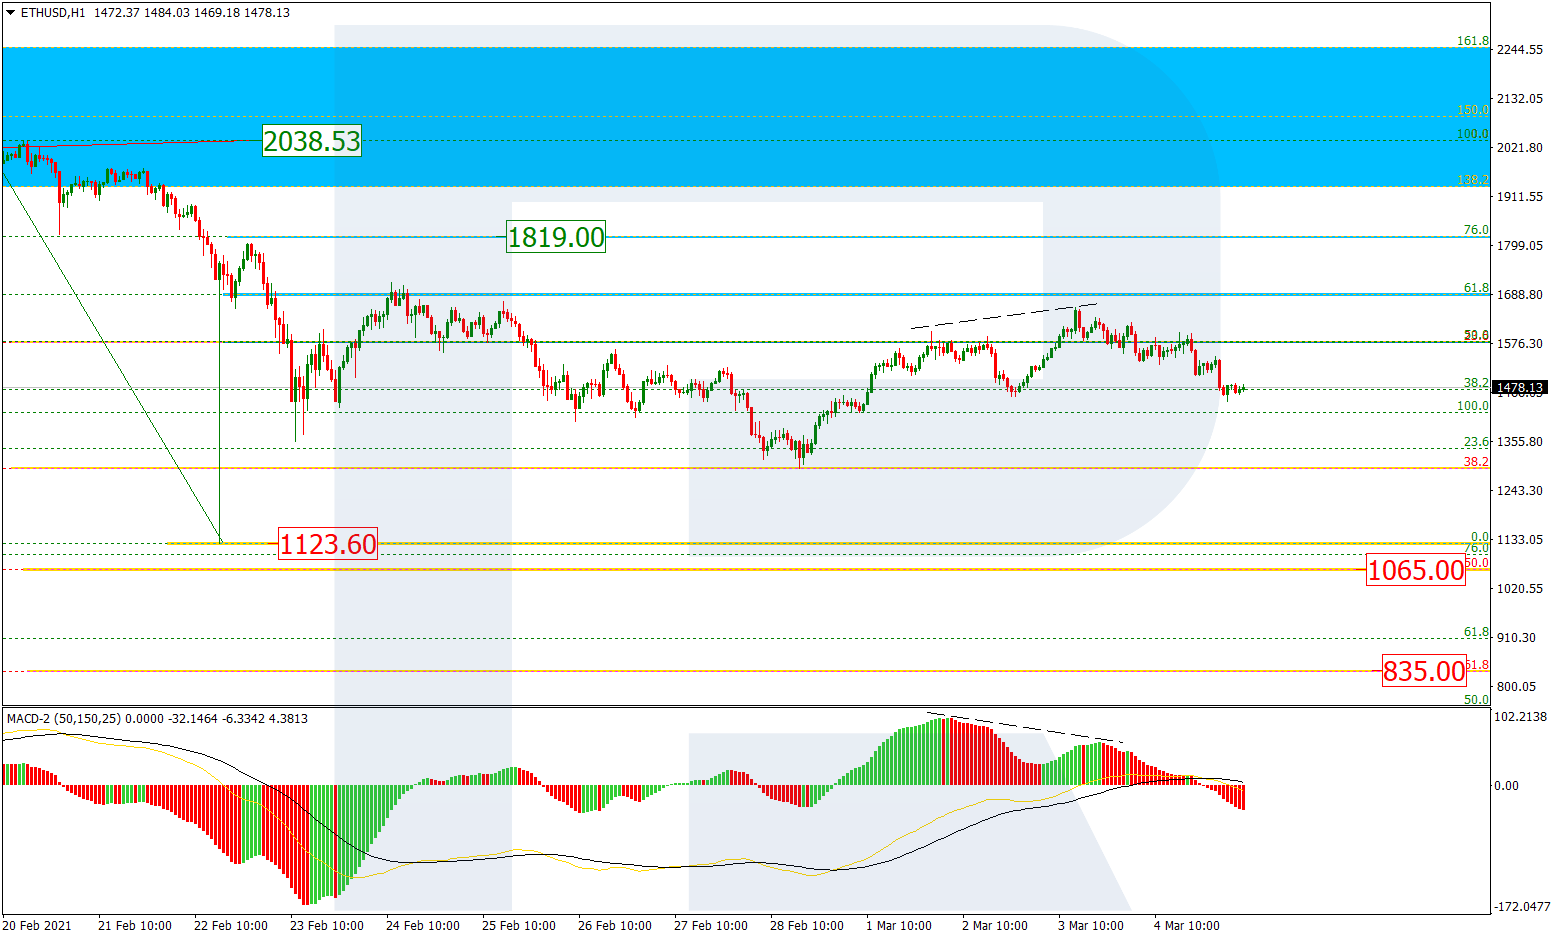
ETHUSD, “Ethereum vs. US Dollar”
As we can see in the H4 chart, after reaching the retracement of 23.6%, ETHUSD started consolidating in the form of the Triangle pattern and has already reached the retracement of 50.0%. If the instrument breaks this pattern to the downside, the price may continue falling towards the next downside targets, which may be the retracements of 61.8% and 76.0% at 200.45 and 187.75 respectively; if to the upside – trade upwards to break the high at 254.14 and then the retracement of 38.2% at 300.00.


In the H1 chart, the pair is trading between the resistance and support levels at 233.70 and 210.60 respectively.

