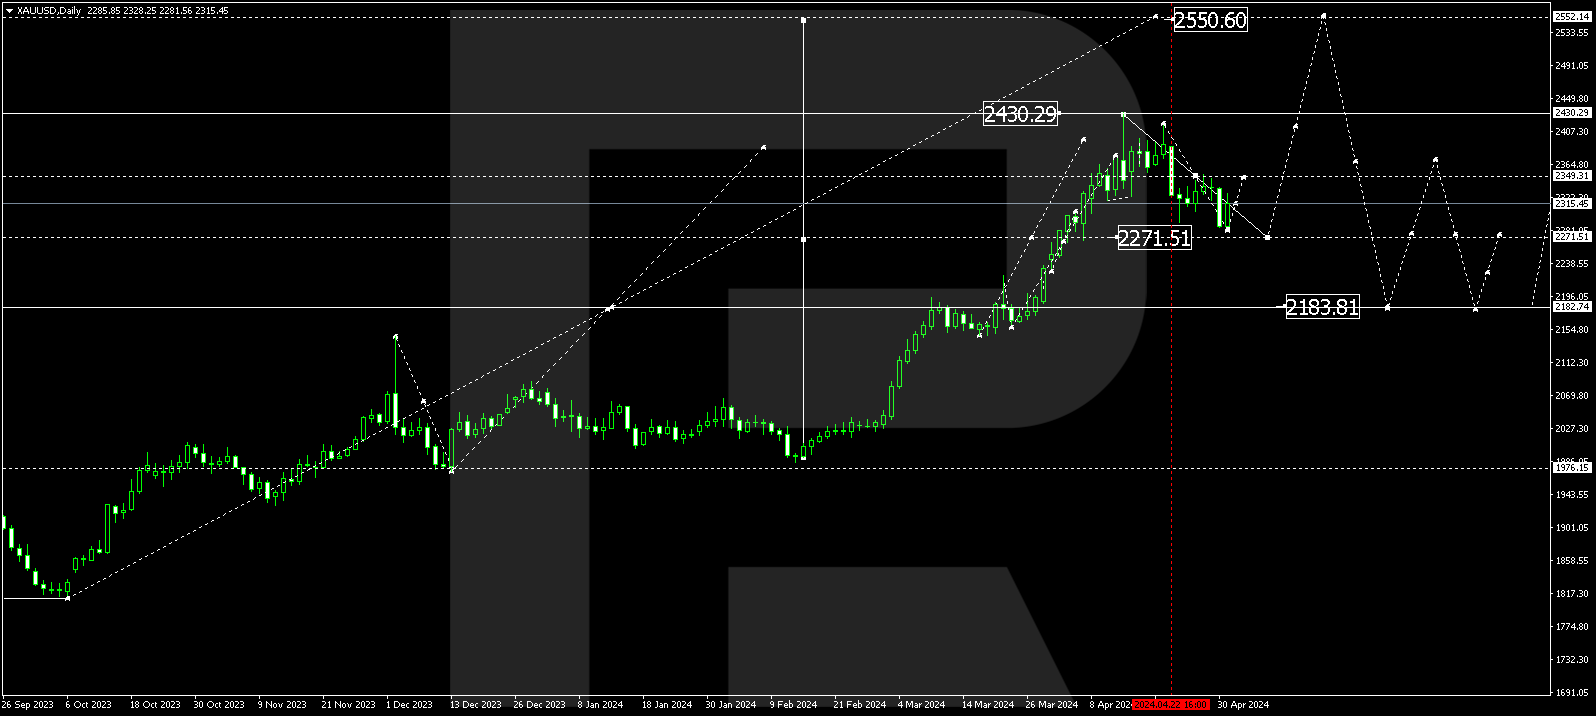
XAUUSD, “Gold vs US Dollar”
The daily chart shows a new rising movement after an attempt to reach 50.0% fibo at 1617 and convergence on MACD. This movement may be the start of another ascending wave towards the high at 2074.75. At the same time, the descending dynamics in the chart imply a possibility of another wave to the downside to reach 50.0% and 61.8% fibo at 1617.00 and 1510.50 respectively.


As we can see in the H4 chart, after breaking 61.8% fibo, the rising wave in XAUUSD is heading towards its next target at 76.0% fibo at 1850.00. At the same time, there is divergence on MACD, which may indicate a reversal soon. Also, if the price breaks 76.0% fibo, the asset may continue its growth towards the fractal high at 1916.52, a breakout of which will confirm the formation of a mid-term ascending wave.


USDCHF, “US Dollar vs Swiss Franc”
In the H4 chart, USDCHF continues trading sideways between 38.2% and 76.0% fibo. This technical picture suggests two possible scenarios – a growth to reach the high at 0.9275, a breakout of which will lead to a further uptrend towards the post-correctional extension area between 138.2% and 161.8% fibo at 0.9373 and 0.9433 respectively, and a decline towards the low at 0.9018, a breakout of which will extend the mid-term correction down to 76.0 fibo and the fractal low at 0.9010 and 0.8926 respectively.


The H1 chart shows a more detailed structure of the current consolidation. The closest upside target may be the local resistance at 0.9242, while the closest downside target is 76.0% fibo at 0.9072.

