GBPUSD, “Great Britain Pound vs US Dollar”
As we can see in the H4 chart, after reaching long-term 76.0% fibo, the descending tendency has stopped. At the same time, there is a convergence on MACD, which is making the price move upwards. All these signals taken together indicate further rising movement. The support is the low at 1.2079.


The short-term scenario is shown on the H1 chart. Here, the convergence also made the pair reverse and start a new growth, which has already reached 23.6% fibo. The next upside targets may be 38.2%, 50.0%, and 61.8% fibo at 1.2246, 1.2298, and 1.2350 respectively.

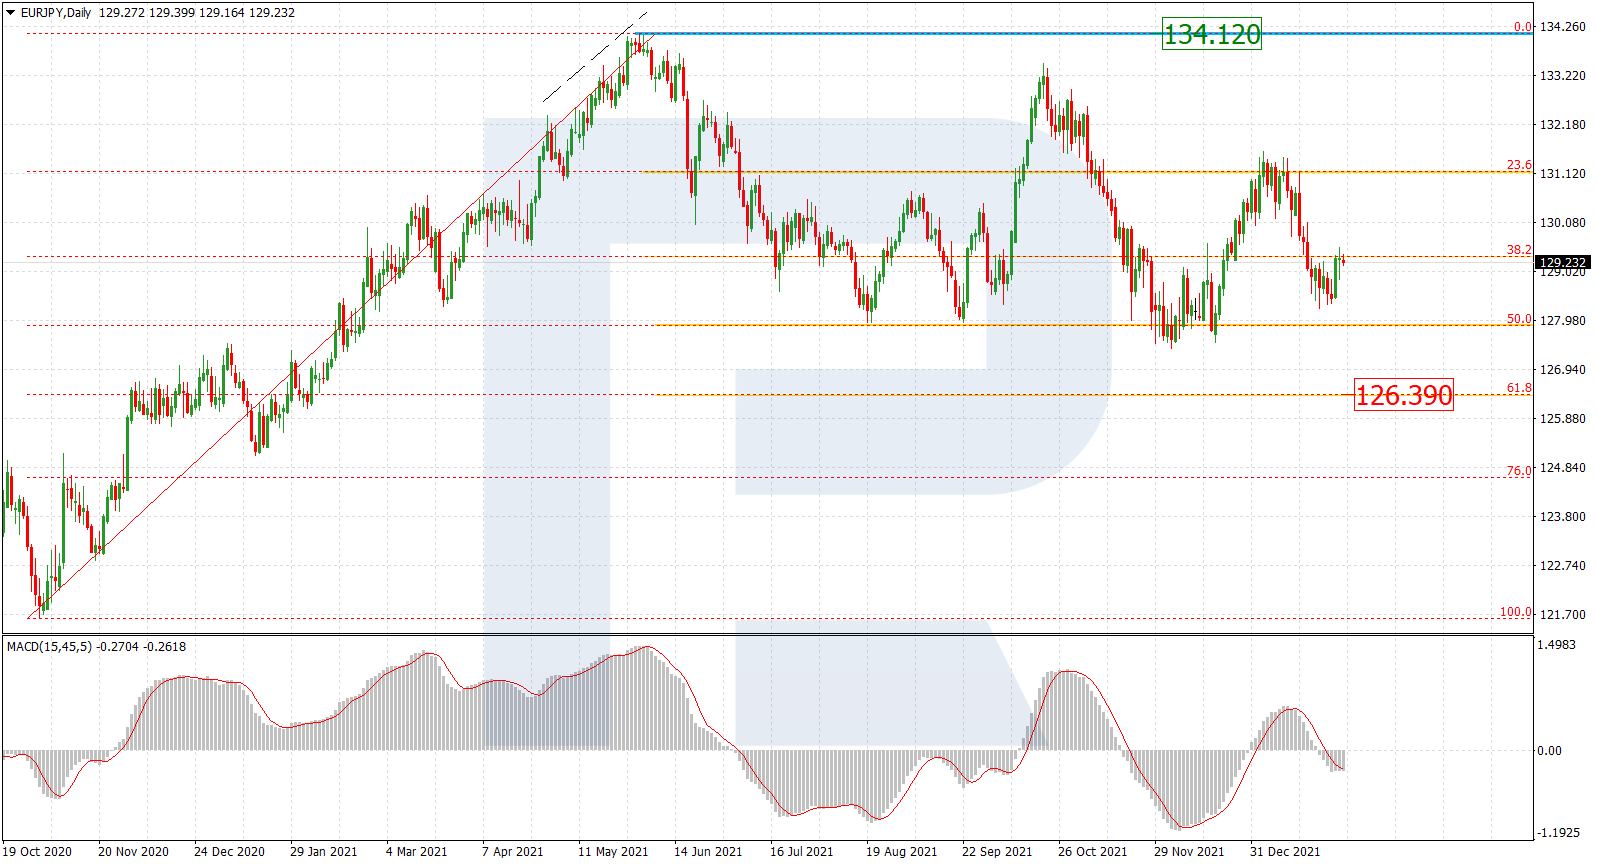
EURJPY, “Euro vs. Japanese Yen”
As we can see in the daily chart, after testing the previous significant low, the price started a new pullback, which prevented the pair from further decline. There is a convergence on MACD, which may indicate a possible reverse and a pullback. After the pullback, the instrument may continue falling towards the post-correctional extension area between 138.2% and 161.8% fibo at 114.35 and 112.10 respectively.
In the H4 chart, the pair has already been corrected by 50.0% and may yet continue moving towards 61.8% and 76.0% fibo at 119.96 and 120.49 respectively. However, judging by MACD, we may assume that further movement will be descending with the targets inside the post-correctional extension area between 138.2% and 161.8% fibo at 116.84 and 115.32. However, it may happen only after the instrument breaks the low at 117.67.
