GBP USD, “Great Britain Pound vs US Dollar”
At the H4 chart, the GBP/USD pair is being corrected to the upside and this correction may transform into a new ascending impulse. By now, the correction has already reached the retracement of 61.8%. The next target of this correction may be the retracement of 76.0% at 1.3150. After breaking this level, the price may move towards the post-correctional extension area between the retracements of 138.2% and 161.8% at 1.3455 and 1.3574 respectively. However, if one considers the situation in the long-term, the price movement over the last month is just a descending correction from longer timeframes. As a result, after breaking the local low at 1.2775, the instrument may continue falling towards the retracements of 38.2% and 50.0% at 1.2690 and 1.2552 respectively.

As we can see at the H1 chart, after forming the divergence, the pair has started a new correction. The targets of this correction may be the retracements of 38.2%, 50.0%, and 61.8% at 1.3016, 1.2996, and 1.2976 respectively. If later the price breaks the local high at 1.3082, the instrument may move towards the post-correctional extension area between the retracements of 138.2% and 161.8% at 1.3180 and 1.3123 respectively.

EUR JPY, “Euro vs. Japanese Yen”
At the H4 chart, the EUR/JPY pair was corrected to the downside by 50.0% and then started a new growth, which may be considered a new ascending impulse. After breaking the current high at 131.70, the price may continue growing towards the post-correctional extension area between the retracements of 138.2% – 161.8% (132.55 – 133.10), which matches the same area from the daily chart.

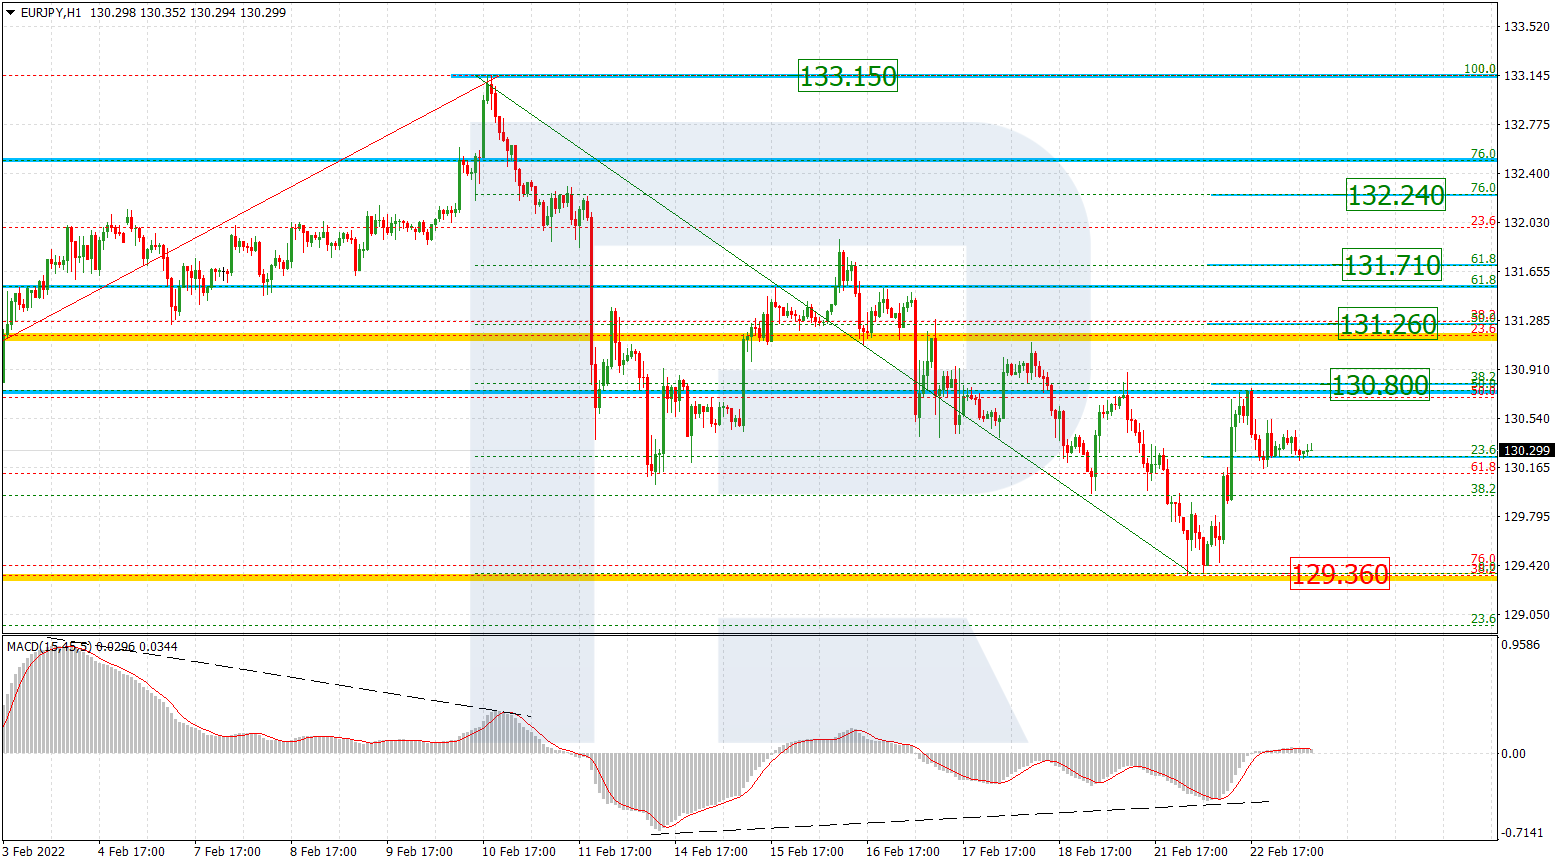
As we can see at the H1 chart, the pair is still being corrected to the upside. The next targets of this correction may be the retracements of 50.0%, 61.8%, and 76.0% at 130.54, 130.81, and 131.14 respectively.
RoboForex Analytical Department