GBPUSD, “Great Britain Pound vs US Dollar”
As we can see in the H4 chart, after a rebound from 38.2% fibo and a local convergence on MACD, GBPUSD is finishing a correction to the upside at 23.6% fibo. If the price forms a new rising impulse and fixes above the latter level, it may be a signal in favor of a new mid-term rising wave to reach the high at 1.3482. However, the most probable scenario implies further decline to reach 50.0% and 61.8% fibo at 1.2446 and 1.2200 respectively.


The H1 chart shows a more detailed structure of the current decline after the divergence on MACD, which has already reached 38.2% fibo. If the pair breaks the high at 1.3007, the price may continue growing towards the mid-term 50.0% fibo at 1.3079. However, considering that the first descending impulse was pretty strong, the market may continue falling to reach 50.0%, 61.8%, and 76.0% fibo at 1.2841, 1.2802, and 1.2755 respectively. The key downside target is the support – the low at 1.2675.

EURJPY, “Euro vs. Japanese Yen”
As we can see in the H4 chart, after a rebound from 38.2% fibo and convergence on MACD, EURJPY is correcting upwards and has returned to 23.6% fibo but failed to fix above it. Possibly, the pair may yet update its local highs but the most probable scenario implies a new descending wave with the targets at 38.2%, 50.0%, and 61.8% fibo at 122.22, 120.75, and 119.25 respectively.

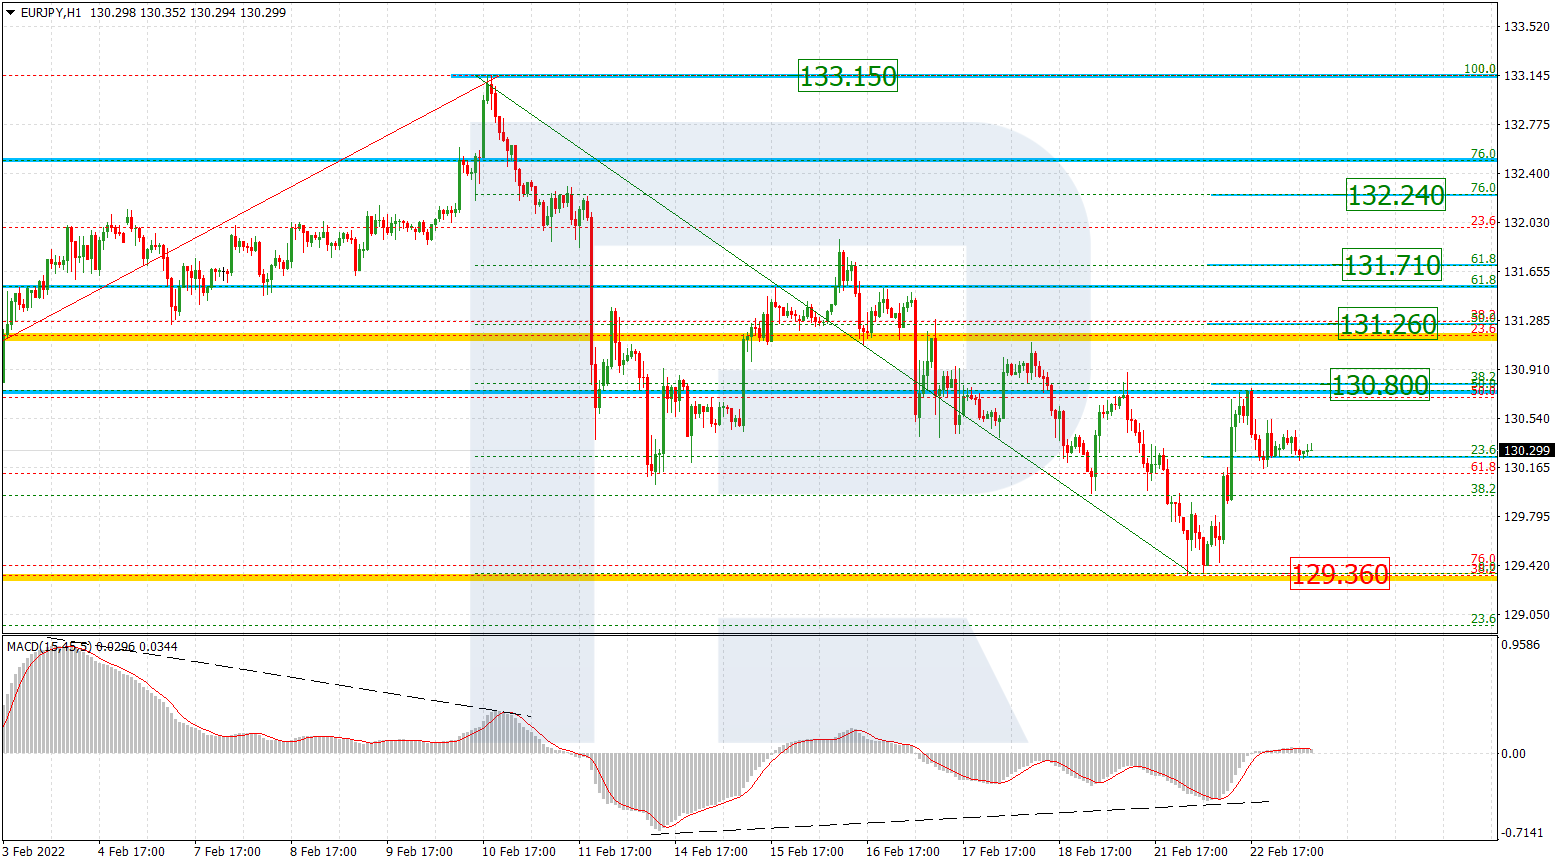
In the H1 chart, the instrument is moving downwards after a divergence on MACD. Despite reaching 38.2% fibo, the asset has chances to reach the high at 124.73, break it, and then continue growing towards mid-term 61.8% and 76.0% fibo at 124.90 and 125.48 respectively. However, taking into account the divergence, the instrument may yet resume falling to reach 50.0%, 61.8%, and 76.0% fibo at 123.55, 123.27, and 122.94 respectively. The key downside target is the low at 122.38.