BTCUSD, “Bitcoin vs US Dollar”
As we can see in the H4 chart, BTCUSD is being corrected to the upside and has already reached the retracement of 38.2%. The next targets of this rising correction may be the retracement of 50.0% and 61.8% at 7830.00 and 8013.00 respectively. The support level is the low at 7051.00.


As we can see in the H1 chart, after being corrected by 50.0%, BTCUSD has started a new ascending movement. If the price breaks the high at 7774.50, the instrument may continue trading towards the post-correctional extension area between the retracements of 138.2% and 161.8% at 7935.00 and 8035.00 respectively.


ETHUSD, “Ethereum vs. US Dollar”
As we can see in the H4 chart, the convergence made ETHUSD finish the downtrend and start a new correction, which has already reached the retracement of 38.2%. The next upside targets may be the retracements of 50.0% and 61.8% at 667.50 and 705.50 respectively. The support level is at 504.50.


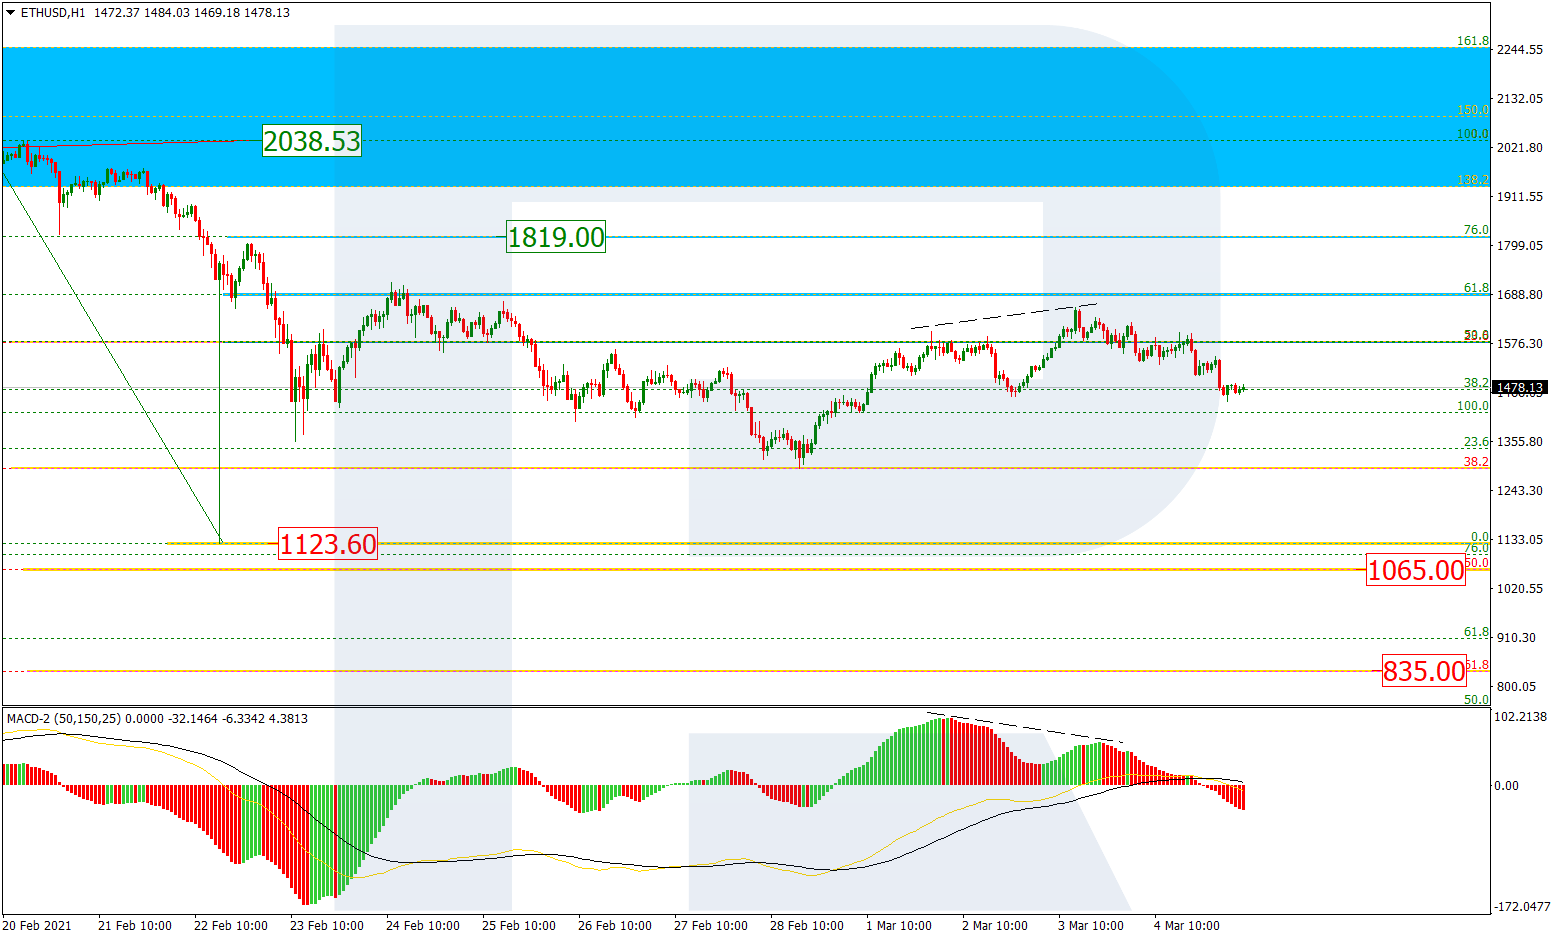
In the H1 chart, ETHUSD is being corrected in the form of the Triangle pattern. By now, the correction has already reached the retracement of 38.2% and may continue towards the retracements of 50.0% and 61.8% at 556.20 and 552.00 respectively.

