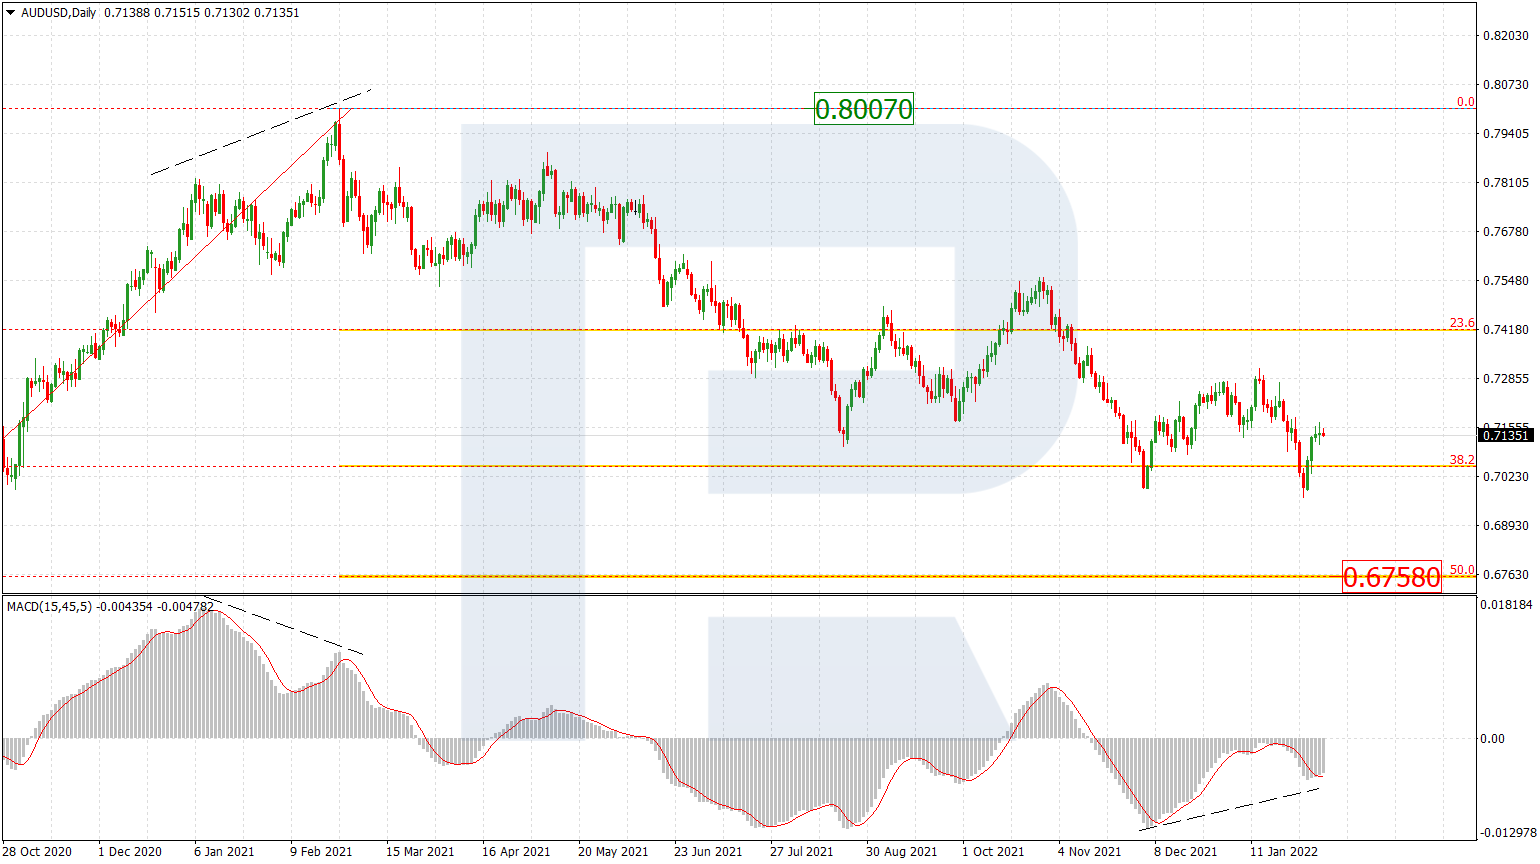
AUDUSD, “Australian Dollar vs US Dollar”
In the daily chart, the pair may grow to break the high at 0.7414 and then continue trading upwards to reach the long-term 76.0% fibo at 0.7504. However, taking into account a divergence on MACD, the instrument may yet resume falling. The first downside target is 23.6% fibo at 0.6963. After breaking it, the instrument may fall to reach 38.2% and 50.0% fibo at 0.6685 and 0.6459 respectively.

The H1 chart shows the correctional descending wave after a divergence on MACD, which has already reached 50.0% fibo. However, right now, the price is rebounding from this level and may later resume growing to reach the high at 0.7209. After breaking the high, AUDUSD may continue trading upwards to reach the mid-term 61.8% and 76.0% fibo at 0.7216 and 0.7263. The support is the low at 0.7006.

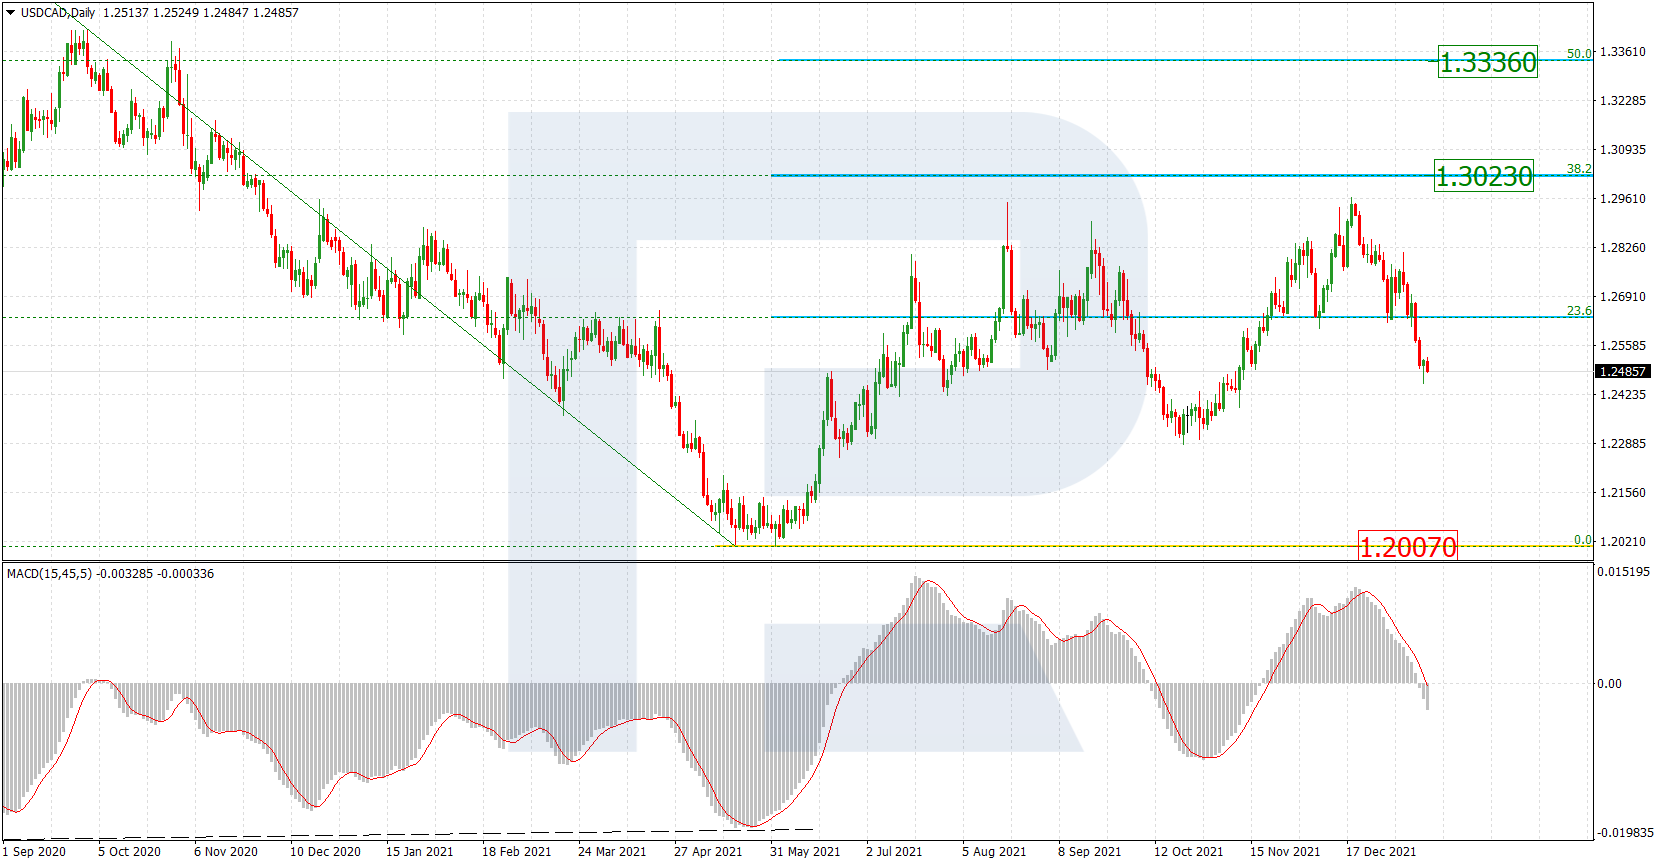
USDCAD, “US Dollar vs Canadian Dollar”
As we can see in the daily chart, after rebounding from 23.6% fibo, the pair is correcting downwards. After the pullback is over, the next upside target will be 38.2% and 50.0% fibo at 1.3634 and 1.3831 respectively. The support is the fractal low at 1.2994.
The H4 chart shows the descending correction, which is trying to test 38.2% fibo and may later continue falling towards 50.0% and 61.8% fibo at 1.3207 and 1.3157 respectively. Still, if the price breaks the high at 1.3420, the correction will be over and then instrument may continue its mid-term growth towards 38.2% fibo at 1.3634.
