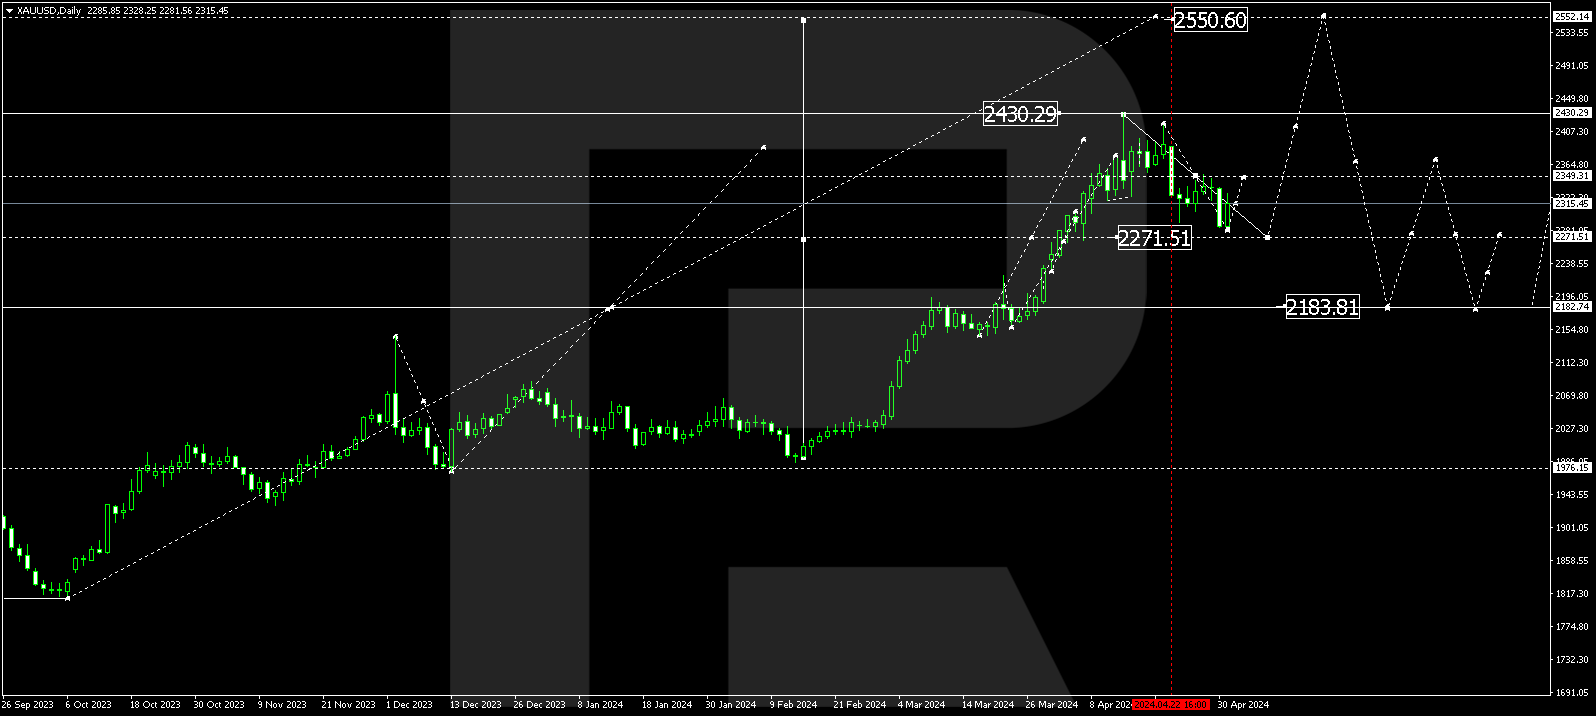
XAUUSD, “Gold vs US Dollar”
As we can see in the daily chart, the long-term trend was a little bit shy of reaching 76.0% fibo at 1708.10. after that, there was a divergence on MACD, which made the pair reverse and start falling. The key downside target may be 50.0% fibo at 1482.50.

In the H4 chart, the correctional downtrend may be followed by a new rising wave. In this case, the upside targets may be above 76.0% fibo (1708.10) inside the post-correctional extension area between 138.2% and 161.8% fibo at 1736.80 and 1767.15 respectively.

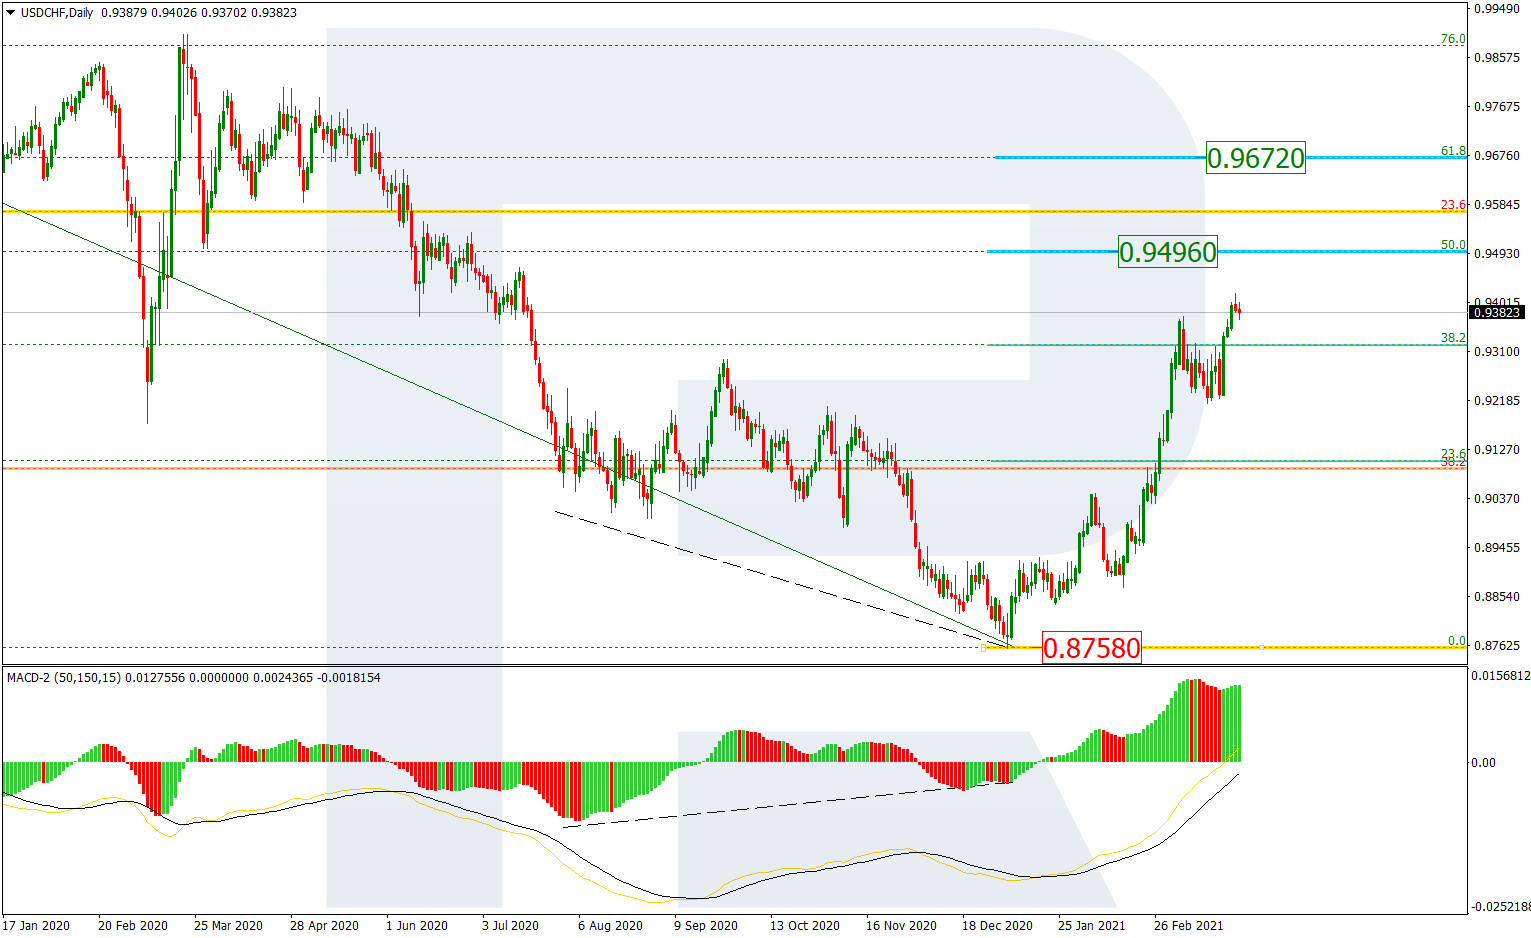
USDCHF, “US Dollar vs Swiss Franc”
As we can see in the daily chart, the long-term bearish trend continues. The pair is heading towards 38.2% and 50.0% fibo at 0.9094 and 0.8707 respectively. the resistance is the high at 1.0344.
In the H1 chart, the pair is quickly plunging towards 38.2% fibo at 0.9094.
