BTCUSD, “Bitcoin vs US Dollar”
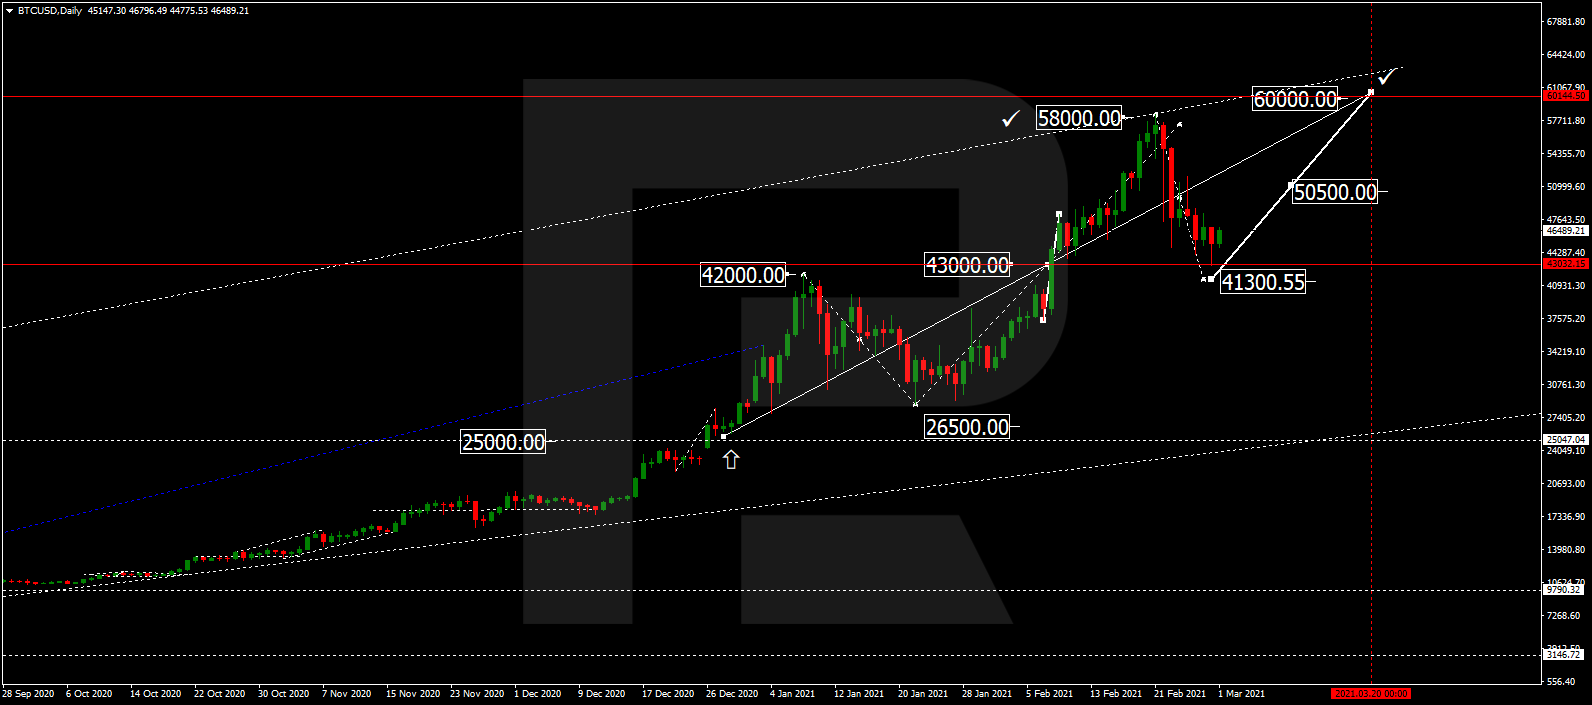
In the daily chart, BTCUSD is still consolidating around 23.6% fibo after a divergence and the first descending wave. However, as we can see, the previous rising impulse is steadily moving towards the key resistance area, which is the high at 12479.50. After breaking this level, the pair may continue growing to reach the fractal high at 13857.20. Still, if the asset chooses to fall, the next descending wave may be heading towards 38.2% and 50.0% fibo at 9220.00 and 8194.00 respectively.


The H4 chart shows the correction to the upside. After growing and reaching 50.0% fibo, the pair has failed to test the low; right now, it is forming a Triangle pattern. The next ascending structure may be heading towards 61.8% and 76.0% fibo at 11468.00 and 11845.00 respectively.


ETHUSD, “Ethereum vs. US Dollar”
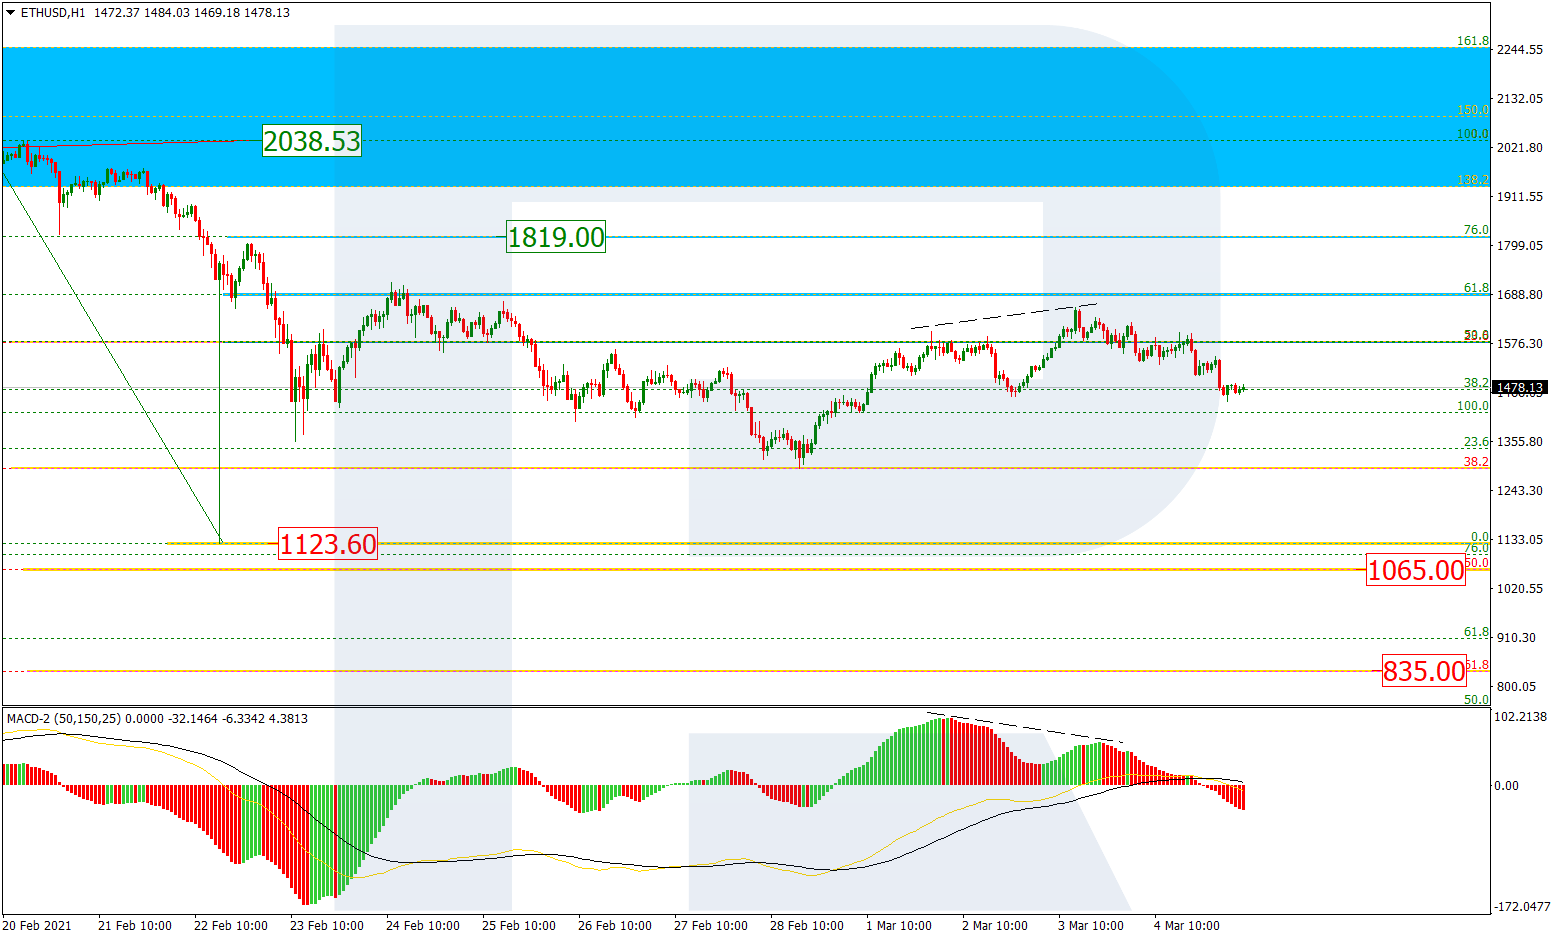
As we can see in the H4 chart, Ethereum is forming a very narrow consolidation range around the mid-term 38.2% fibo. If the pair breaks the low at 305.42, it may continue falling towards 50.0% fibo at 289.40. However, if the asset breaks this range upwards, the instrument may resume growing to reach 50.0% and 61.8% fibo at 418.75 and 444.60 respectively. The key upside target and the resistance are the high at 488.68.


In the H1 chart, the pair is correcting after the divergence it has already tested 61.8% fibo twice. Later, the price may fall towards 76.0% fibo at 326.60, as well as the low at 312.81. The local resistance is the high at 370.00.

