Brent
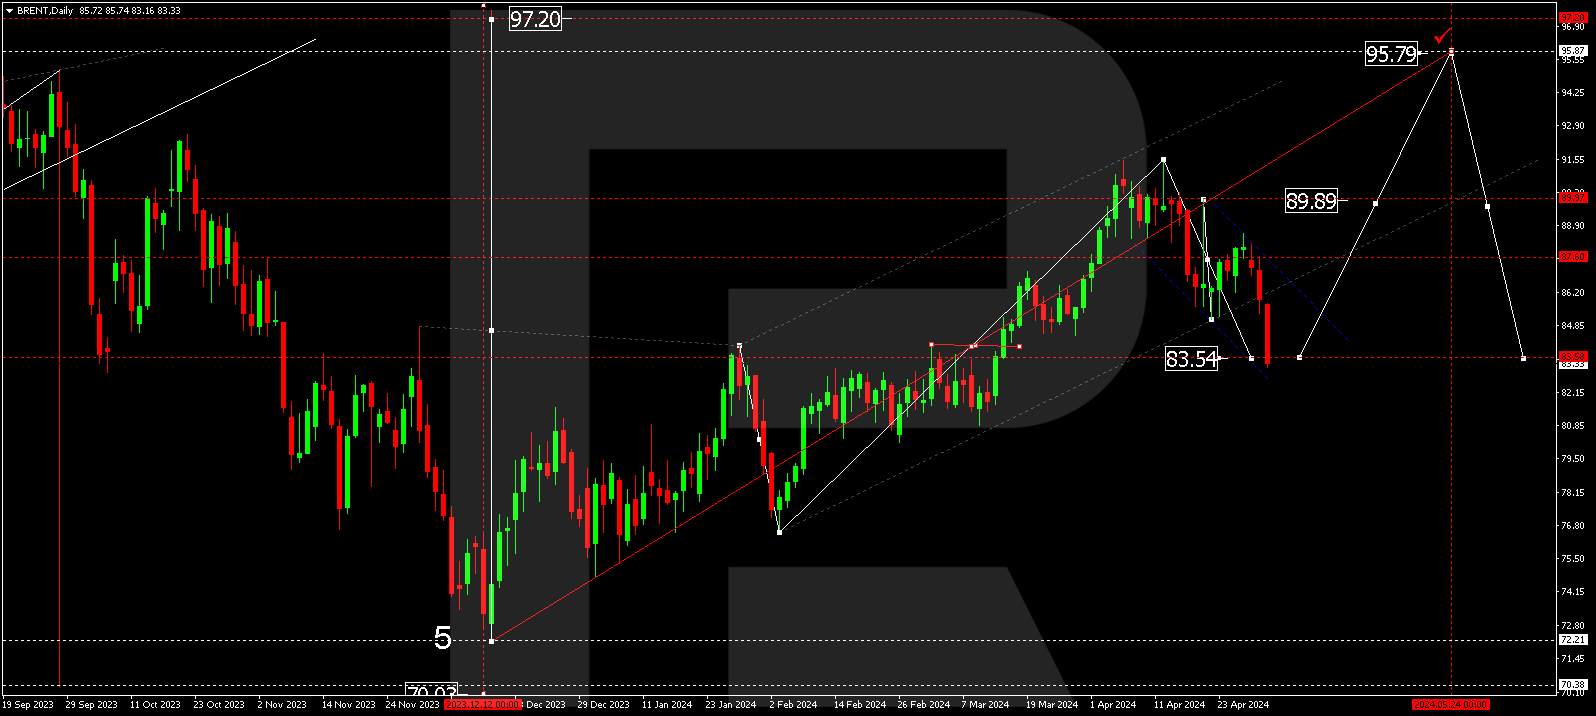
As we can see in the daily chart, Brent is correcting upwards after reaching the long-term 23.0% fibo and divergence on MACD. If this correctional uptrend fails to break the high at 86.63, the next downside targets may be 38.2%, 50.0%, and 61.8% fibo at 59.53, 51.20, and 42.86 respectively.


The H1 chart shows that after convergence on MACD the rising wave has reached 50.0% fibo. Despite local divergence on MACD, which may hint at a new descending wave towards the low at 65.89, Brent may yet form another impulse to the upside to reach 61.8% fibo at 78.69.


Dow Jones
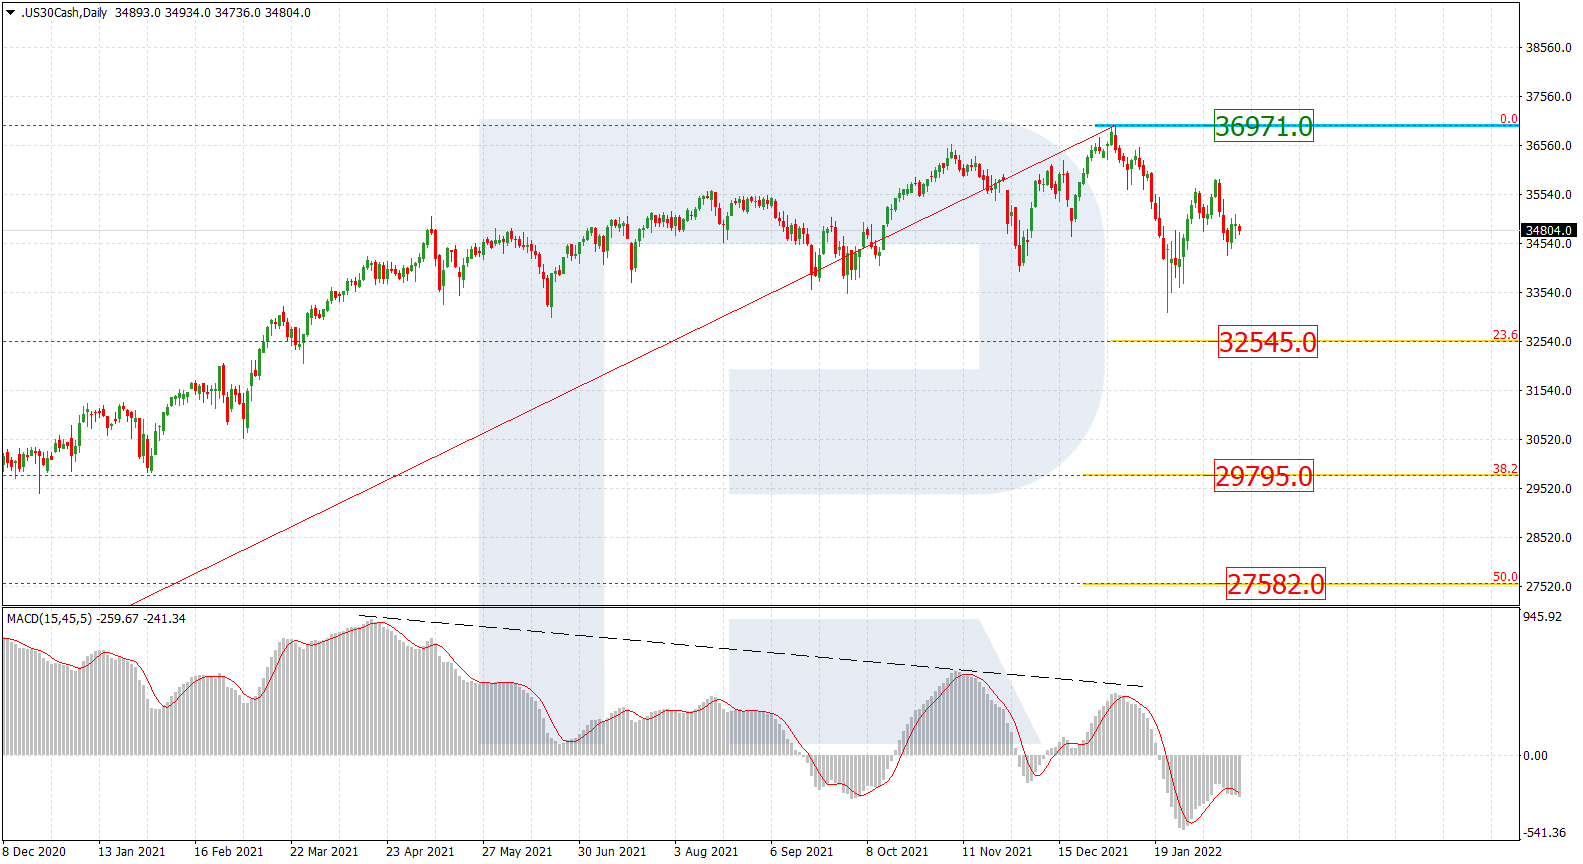
As we can see in the daily chart, after completing the descending wave, the index is steadily growing. if the asset fails to break the high at 36570.0, the next downside targets are 23.6%, 38.2%, 50.0%, and 61.8% fibo at 32230.0, 29550.0, 27380.0, and 25224.0 respectively.


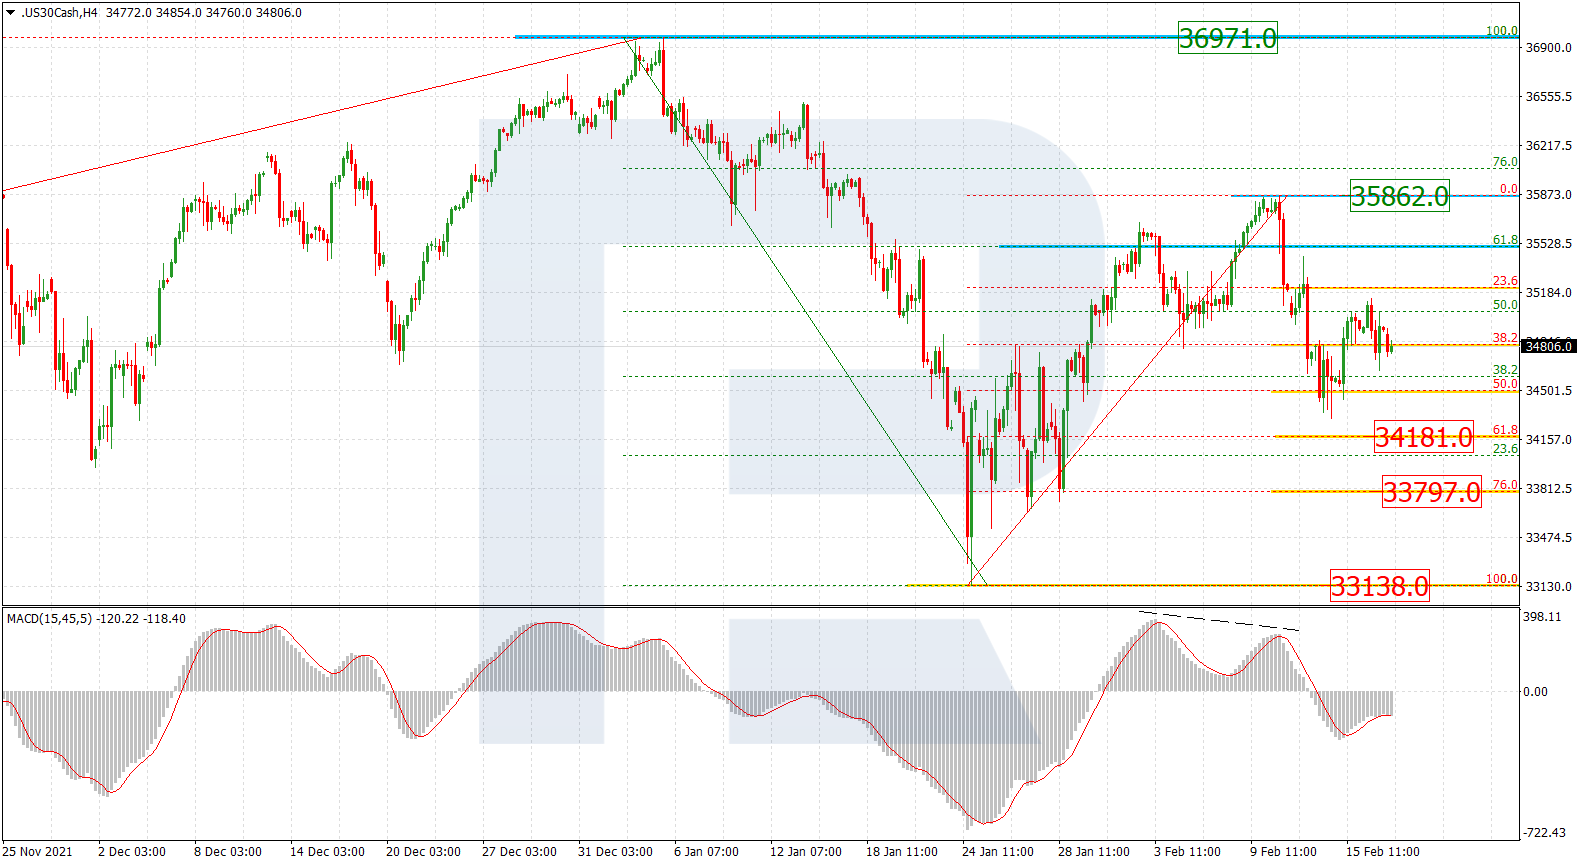
The H4 chart shows the rising wave has reached 76.0% fibo. A breakout of the high at 36570.0 may lead to a further uptrend towards the post-correctional extension area between 138.2% and 161.8% fibo at 37559.0 and 38176.5 respectively. On the other hand, if the asset breaks the low at 33962.0, the price will continue its decline.

