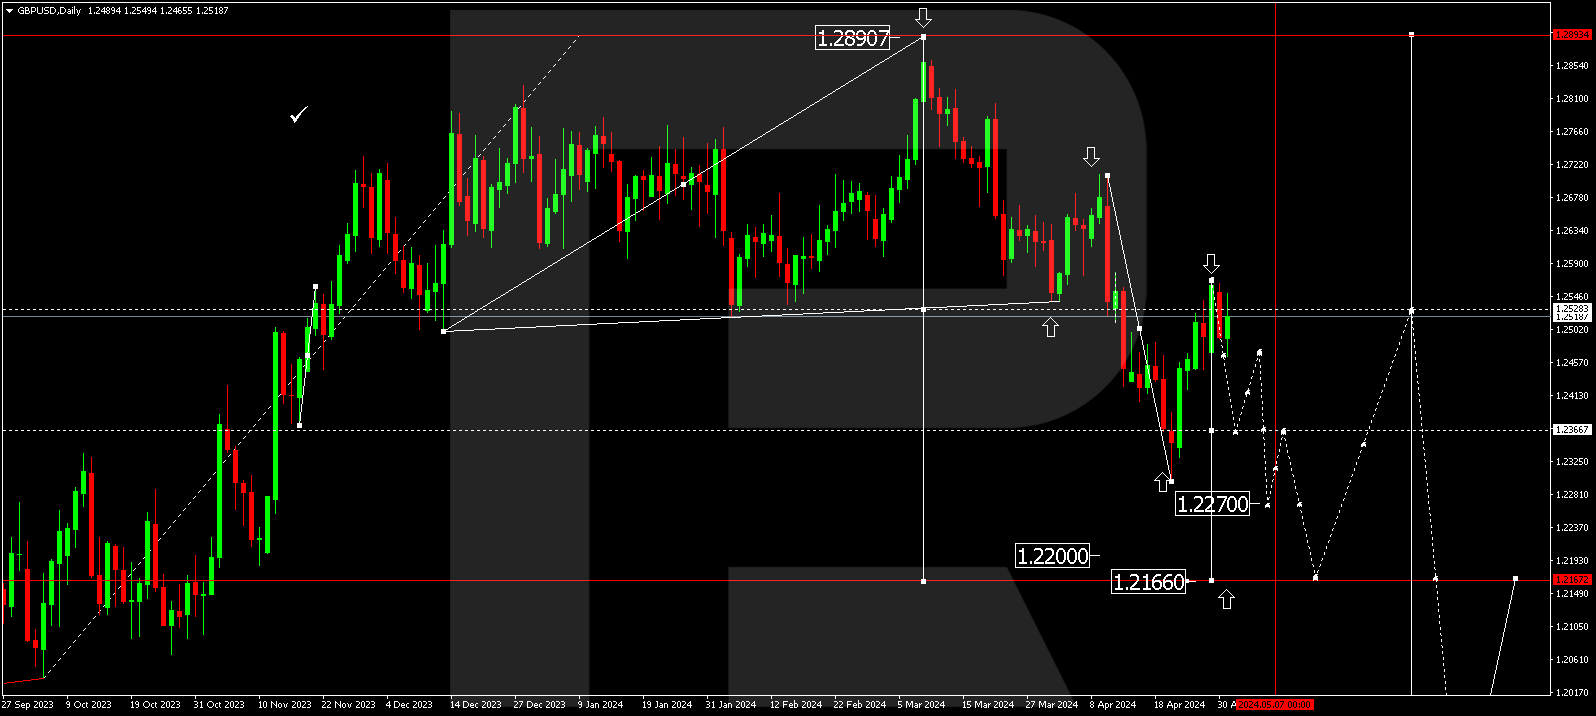
GBPUSD, “Great Britain Pound vs US Dollar”
As we see in the daily chart, after breaking the high at 1.2648, GBPUSD is forming a steady rising impulse towards 50.0% and 61.8% fibo at 1.2890 and 1.3240 respectively. The support is at 23.6% fibo at 1.2110.

The H4 chart shows more detailed structure of the current ascending movement. After completing the descending wave and then forming a new rising one to break high, the pair is moving towards the post-correctional extension area between 138.2% and 161.8% fibo at 1.2865 and 1.3000 respectively. At the same time, there is a divergence on MACD, which may indicate a possible pullback soon.

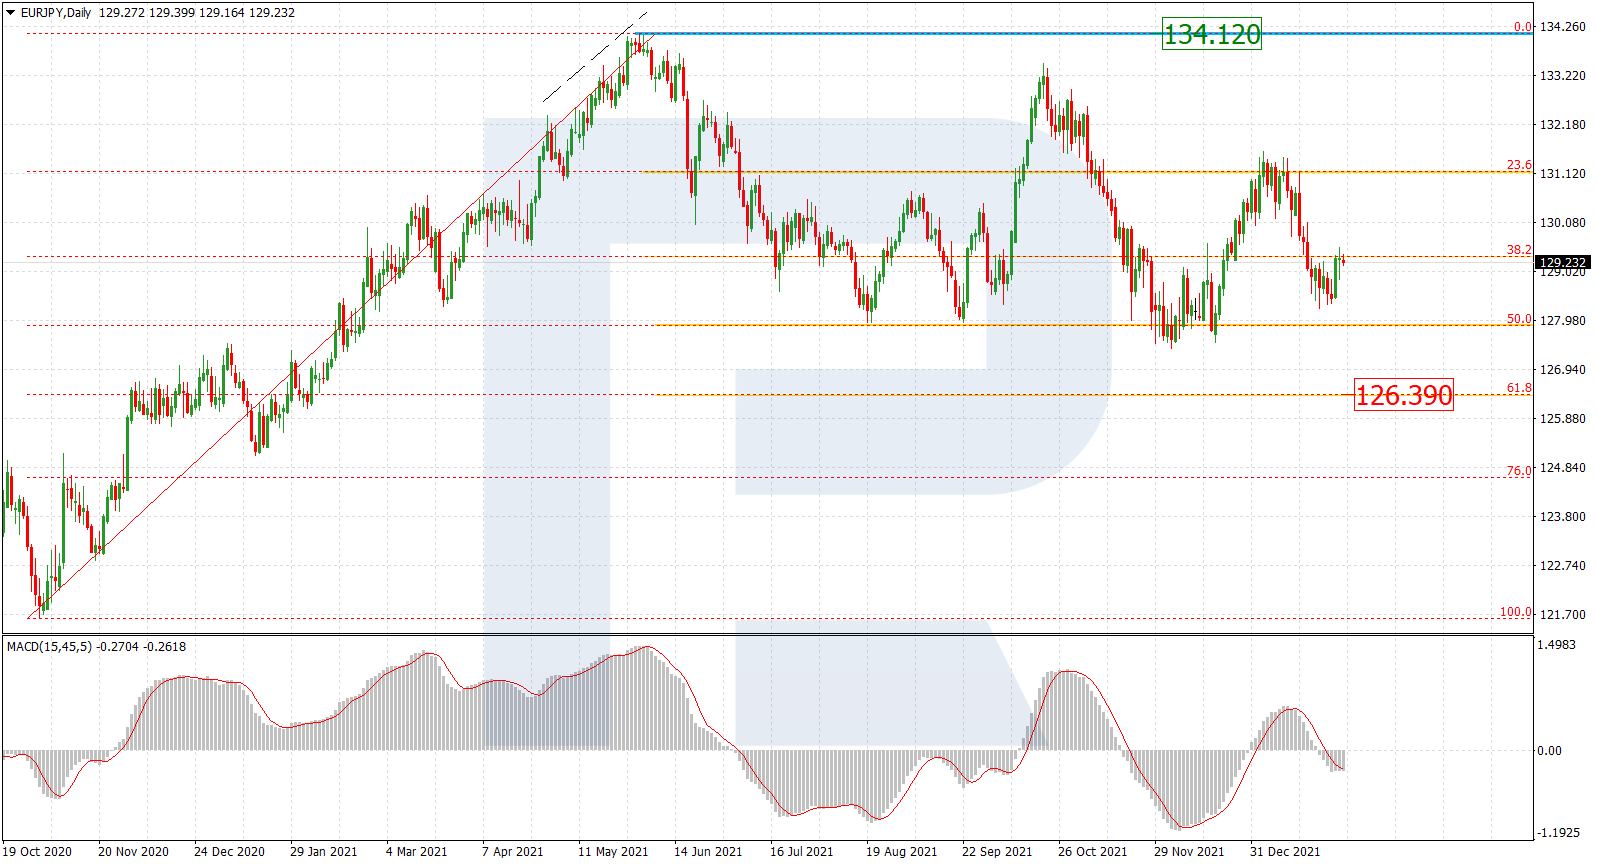
EURJPY, “Euro vs. Japanese Yen”
As we can see in the daily chart, after reaching 38.2% fibo at 123.22, EURJPY has started a new pullback. Later, the pair may complete the correction and resume growing towards 50.0% and 61.8% fibo at 125.95 and 128.67 respectively. The support is 23.6% fibo at 119.85.
In the H4 chart, EURJPY is falling towards the support at 23.6% fibo (119.85). After finishing the correction, the instrument may continue trading to reach the post-correctional extension area between 138.2% and 161.8% fibo at 126.08 and 128.10 respectively.
