GBPUSD, “Great Britain Pound vs US Dollar”
As we can see in the H4 chart, the current downtrend is moving towards the long-term low at 1.2395. However, the key targets are inside the post-correctional extension area between 138.2% and 161.8% fibo at 1.2402 and 1.2335 respectively. The resistance is the current fractal high at 1.2784.


In the H1 chart, the pair is trading downwards. At the same time, there is a convergence on MACD, which indicates a new pullback after the price reaches its closest target at 1.2402. The targets of this pullback may be 23.6%, 38.2%, and 50.0% fibo at 1.2492, 1.2548, and 1.2593).

EURJPY, “Euro vs. Japanese Yen”
As we can see in the H4 chart, the correction continues. There is a possibility that the price may start a new correctional uptrend towards 50.0% fibo at 123.80, but this possibility is very unlikely. According to the main scenario, the instrument may fall to break the low at 120.78 and then mid-term 76.0% fibo at 120.25.

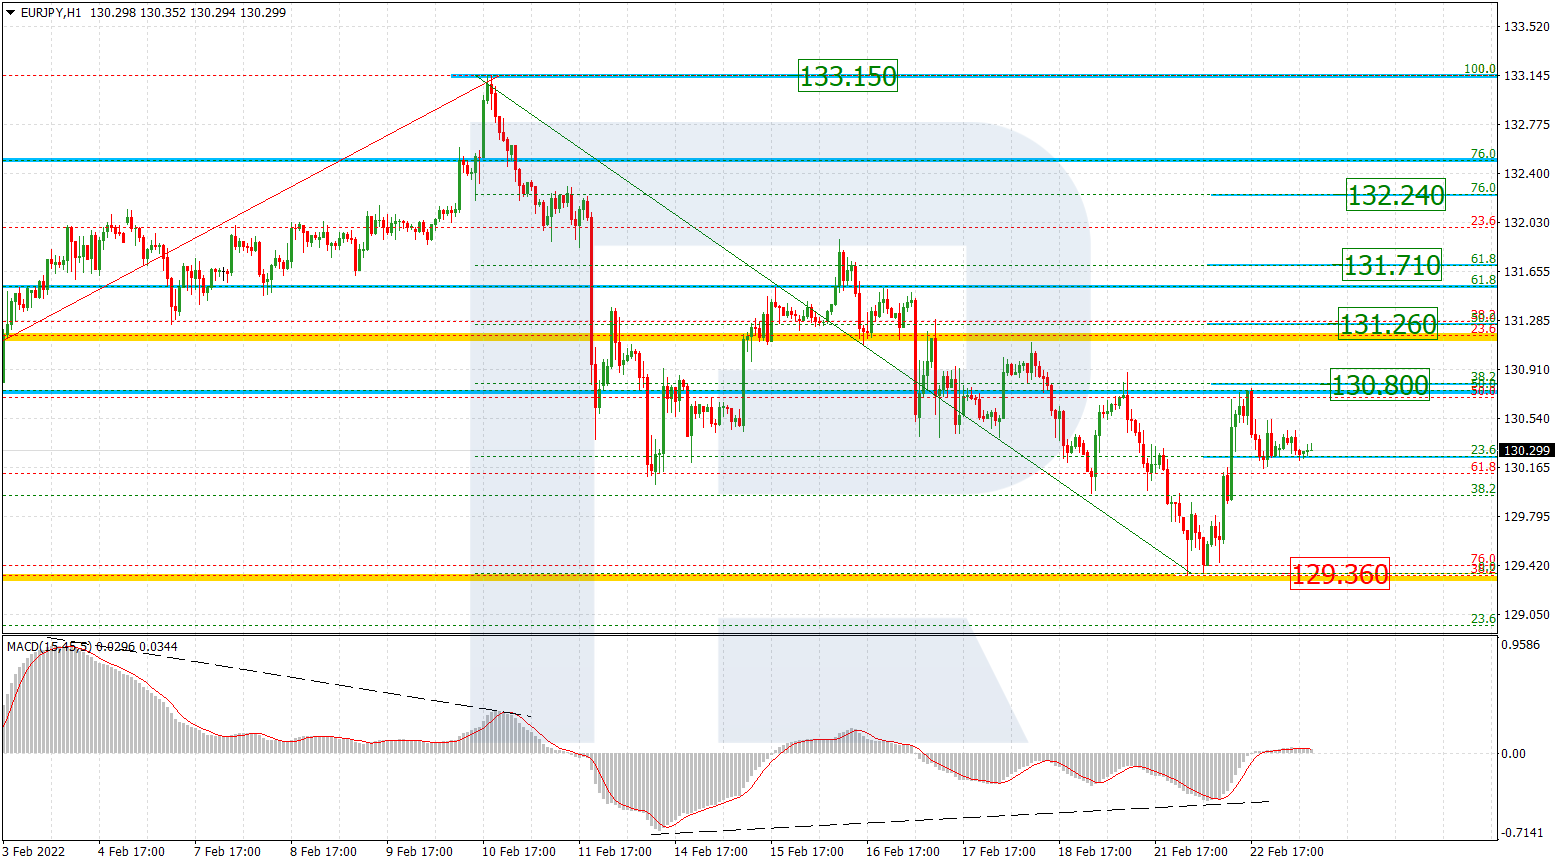
In the H1 chart, the pair completed the descending wave and started a new correction, which has already reached 38.2% fibo. Later, the correction may reach 50.0% at 122.34. After completing it, the instrument may start a new descending wave towards the local low at 121.31 and the key one at 120.78.