BTC USD, “Bitcoin vs US Dollar”
As we can see at the H4 chart, the divergence, which indicates a possible reverse, is about to finish. The closest targets of the future decline are the retracements of 23.6%, 38.2%, and 50.0% at 6851.00, 6212.00, and 5688.00 respectively.

At the H1 chart, the current situation is the same.

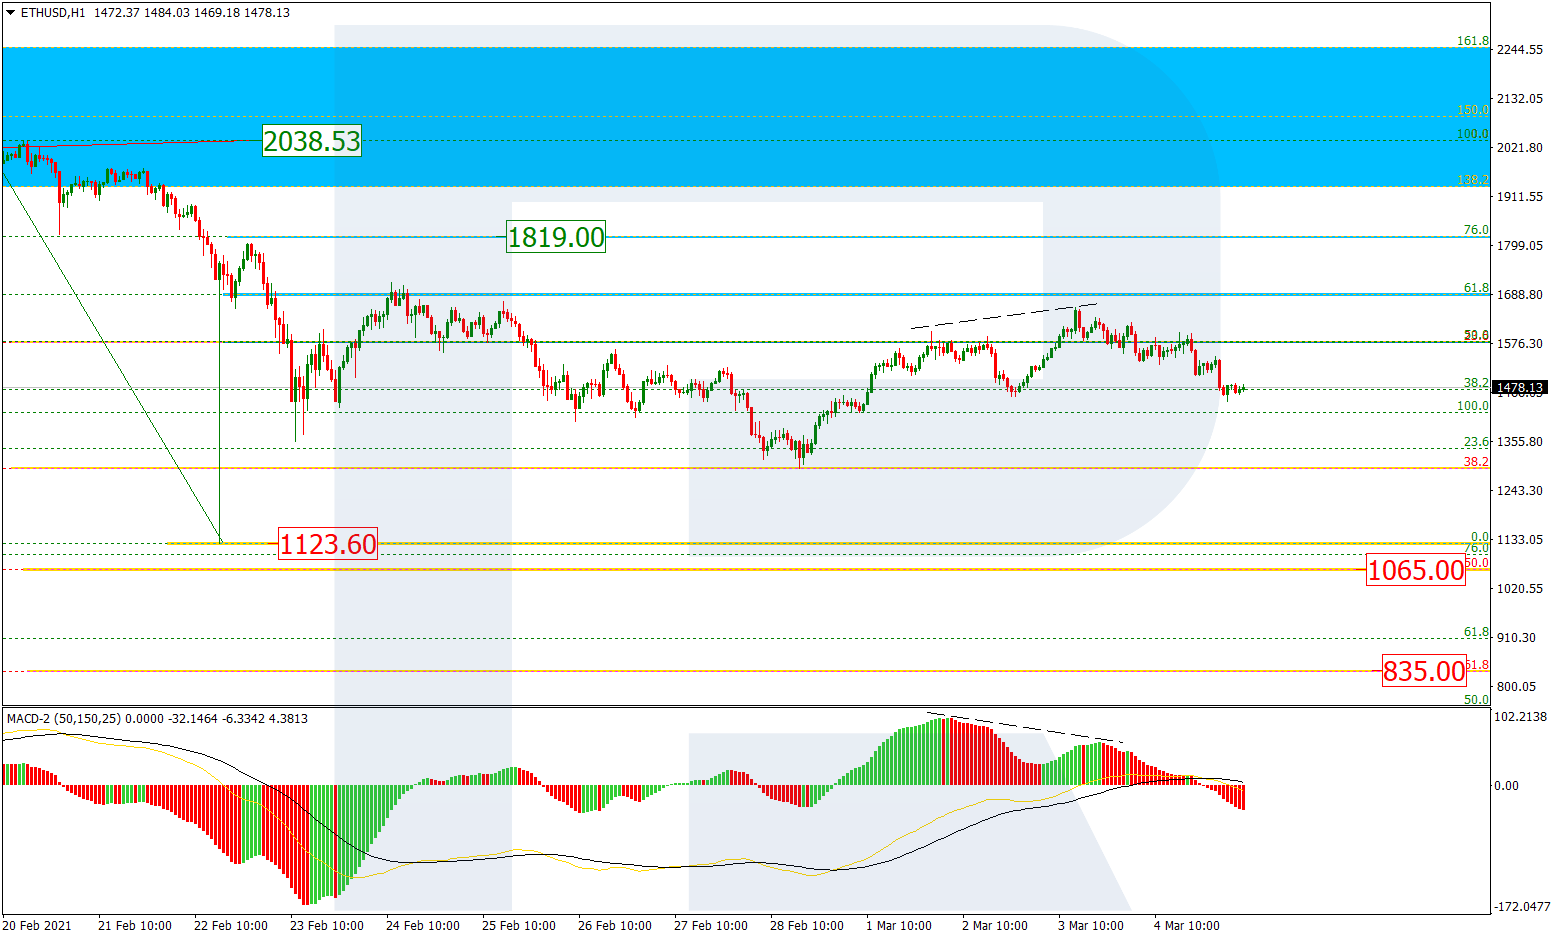
ETH USD, “Ethereum vs. US Dollar”
As we can see at the H4 chart, the ETH/USD pair is forming the ascending impulse. However, the mid-term tendency is limited by a triangle sideways range. In the nearest future, the price may start a new short-term correction towards the retracements of 50.0% and 61.8% at 307.45 and 302.34 respectively. After finishing the correction, the instrument may resume growing towards the local high at 328.67, break it, and then continue moving upwards to reach 346.82.

At the H1 chart, the current situation is similar.

RoboForex Analytical Department