Brent
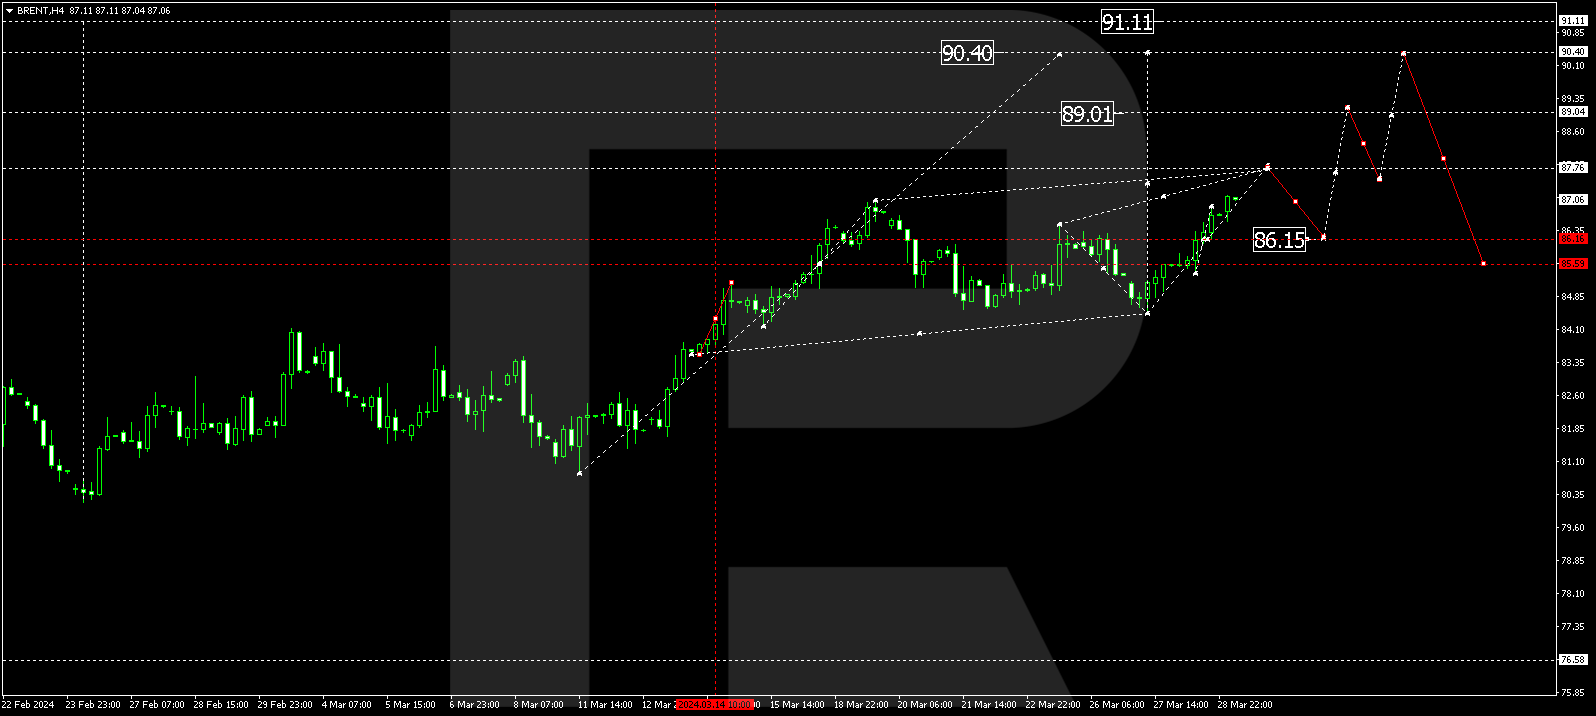
The H4 chart shows a long-term ascending tendency, which seems pretty stable. After reaching 76.9% fibo, Brent has started a new short-term pullback. Despite the stable uptrend, there is a divergence on MACD, which may hint at a reversal and possible decline towards 23.6%, 38.2%, 50.0%, and 61.8% fibo at 62.91, 57.86, 53.77, and 49.69 respectively. A breakout of the high at 71.07 may complete the correction and lead to a further uptrend to reach the fractal high at 87.09.

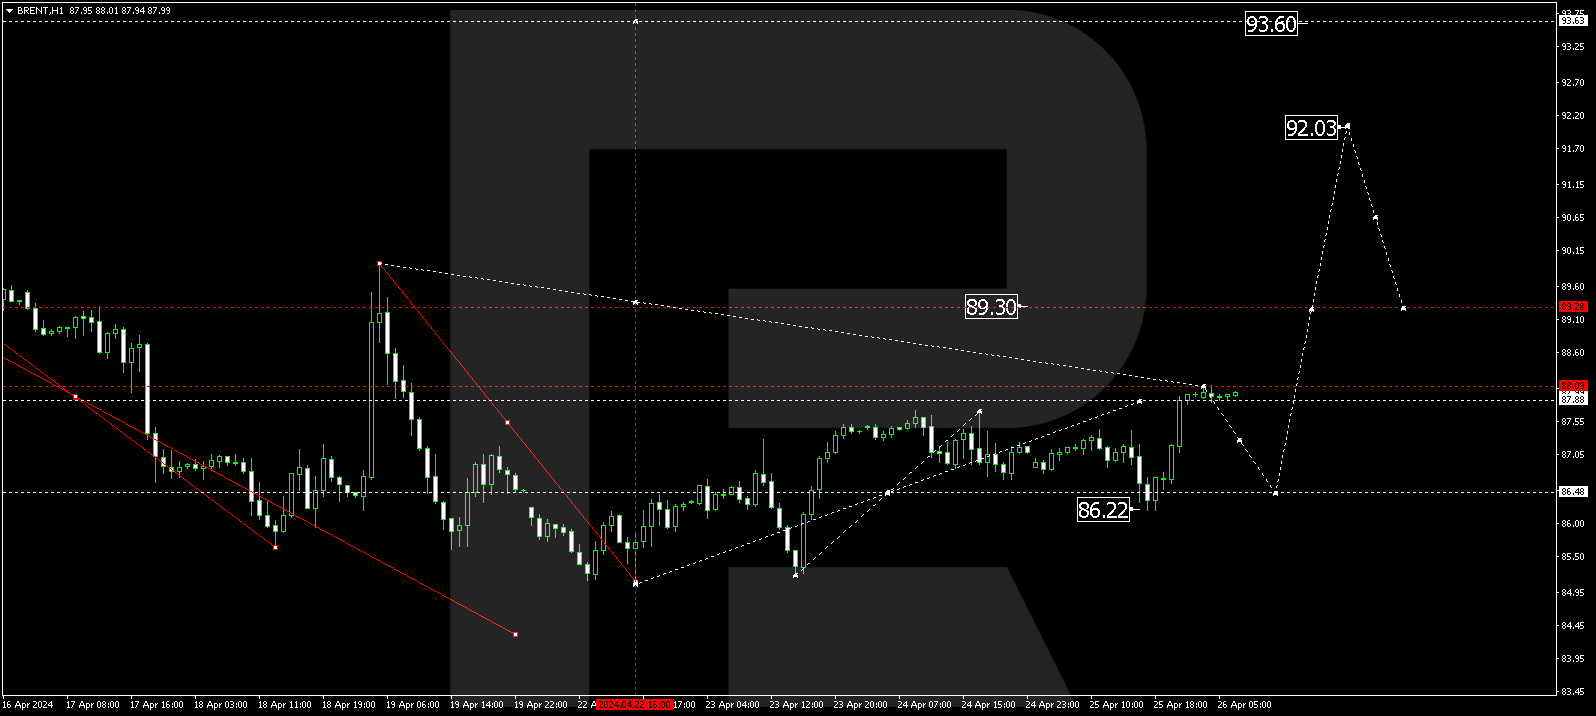
As we can see in the H1 chart, the correctional decline has reached 50.0% fibo. One shouldn’t exclude a possibility of another decline towards 61.8% fibo at 65.64 but only after a breakout of the support at 66.27. If the price fails to break the support, the short-term growth may transform into a proper rising wave towards the high at 71.07, a breakout of which may result in a further uptrend to reach the post-correctional extension area between 138.2% and 161.8% fibo at 72.89 and 74.03 respectively.
Dow Jones
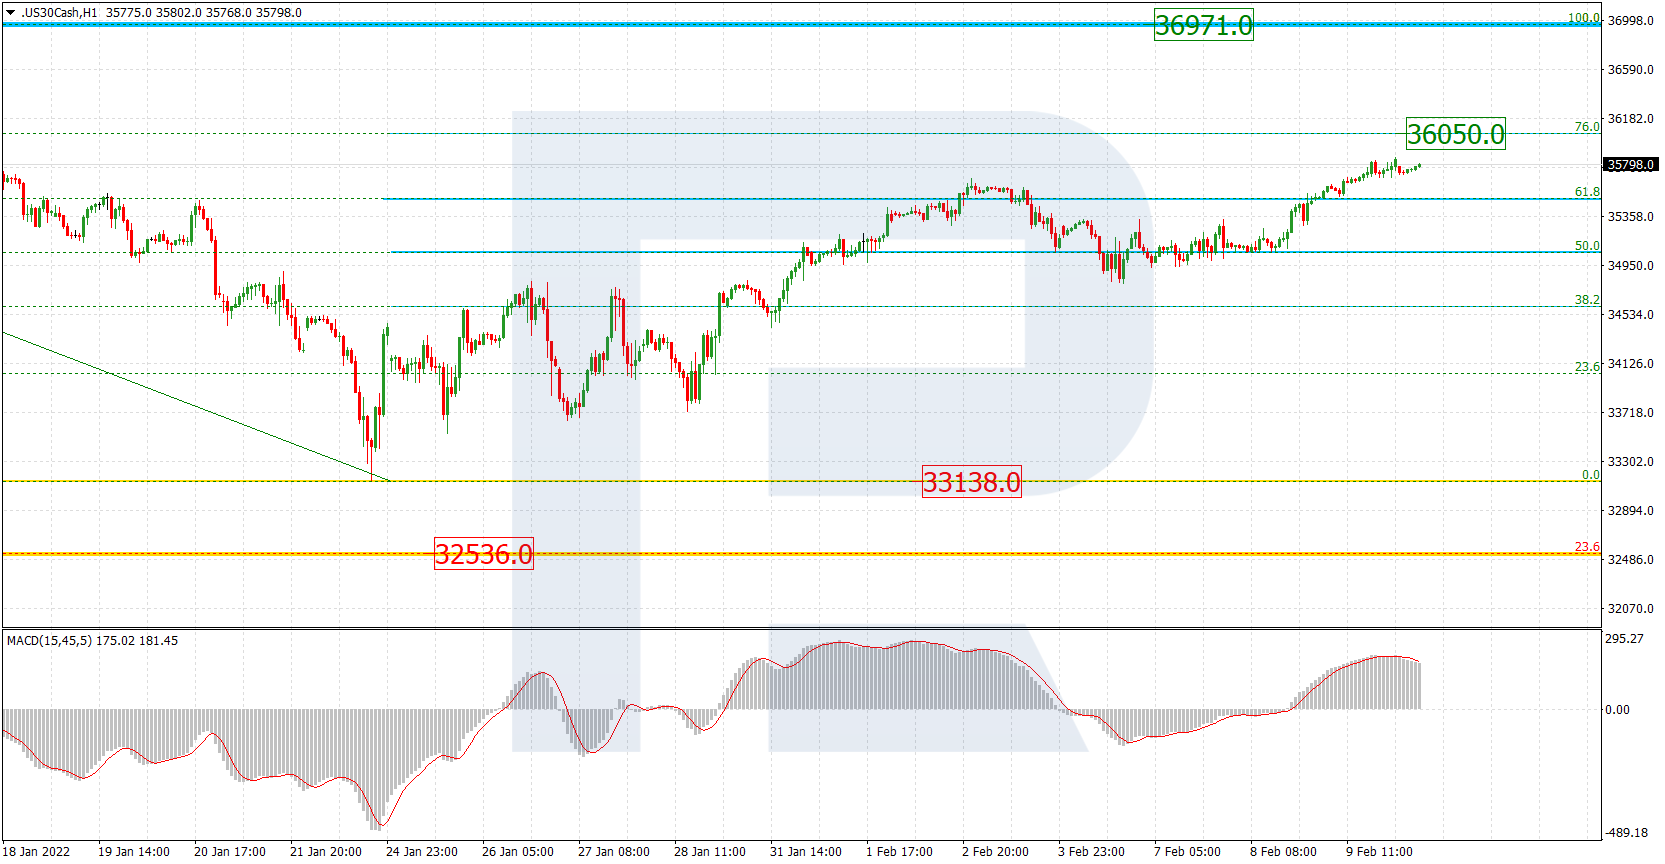
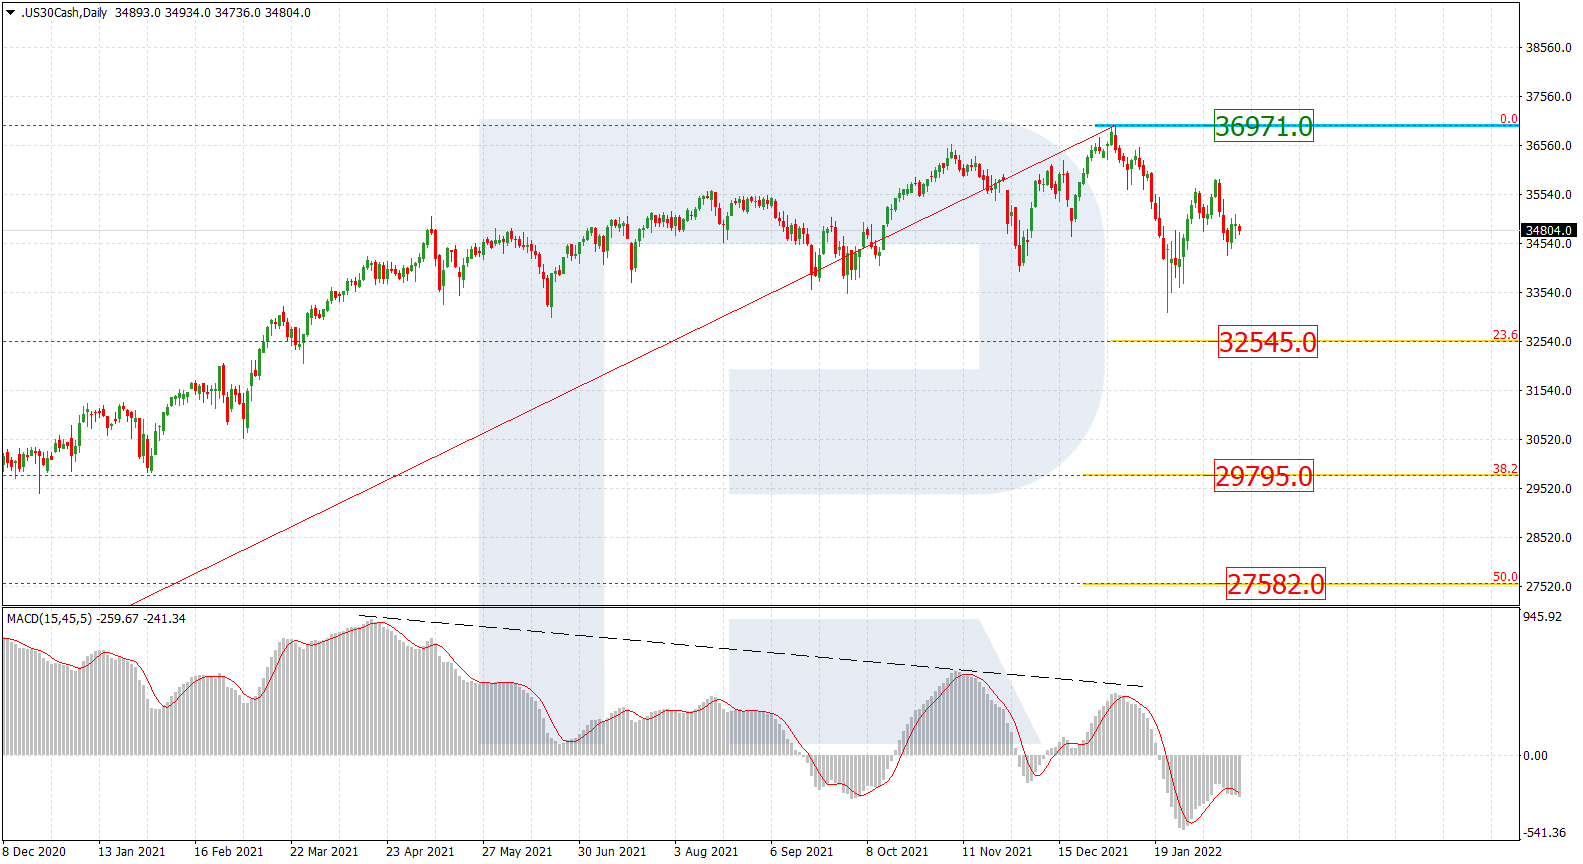
The daily chart shows that the Dow Jones index continues rising and updating its highs one after another. After breaking the previous high at 29585.0, the asset is expected to continue growing towards the post-correctional extension area between 138.2% and 161.8% fibo at 33916.0 and 36629.0 respectively. At the same time, there is divergence on MACD, which may indicate a new pullback to teach 29585.0.
In the H1 chart, after breaking 32084.0, the asset is moving towards the local post-correctional extension area between 138.2% and 161.8% fibo at 32669.0 and 33026.0 respectively. However, a divergence on MACD may hint at a new pullback towards the level broken earlier.