BTCUSD, “Bitcoin vs US Dollar”
As we can see in the H4 chart, after breaking the local high at 8530.70, the rising correction has reached 38.2% fibo. The next upside targets may be 50.0% and 61.8% fibo at 9075.00 and 9405.00 respectively. If the price breaks the low at 7675.00, BTCUSD will continue falling to reach the mid-term correctional target, 61.8% fibo at 7350.00.


In the H1 chart, the divergence made the pair start a new short-term pullback, which is getting close to 38.2% fibo at 8410.80. Later, this decline may continue towards 50.0% and 61.8% fibo at 8290.30 and 8167.50 respectively. The resistance is at 8809.00.


ETHUSD, “Ethereum vs. US Dollar”
As we can see in the H4 chart, the correctional uptrend has reached 61.8% fibo, which is the resistance of the long-term descending channel. In this case, the ETHUSD is expected to start a new decline. After breaking the low at 152.28, this decline may be heading towards 76.0% fibo at 148.60 and then the post-correctional extension area between 138.2% and 161.8% fibo at 140.40 and 125.85 respectively.


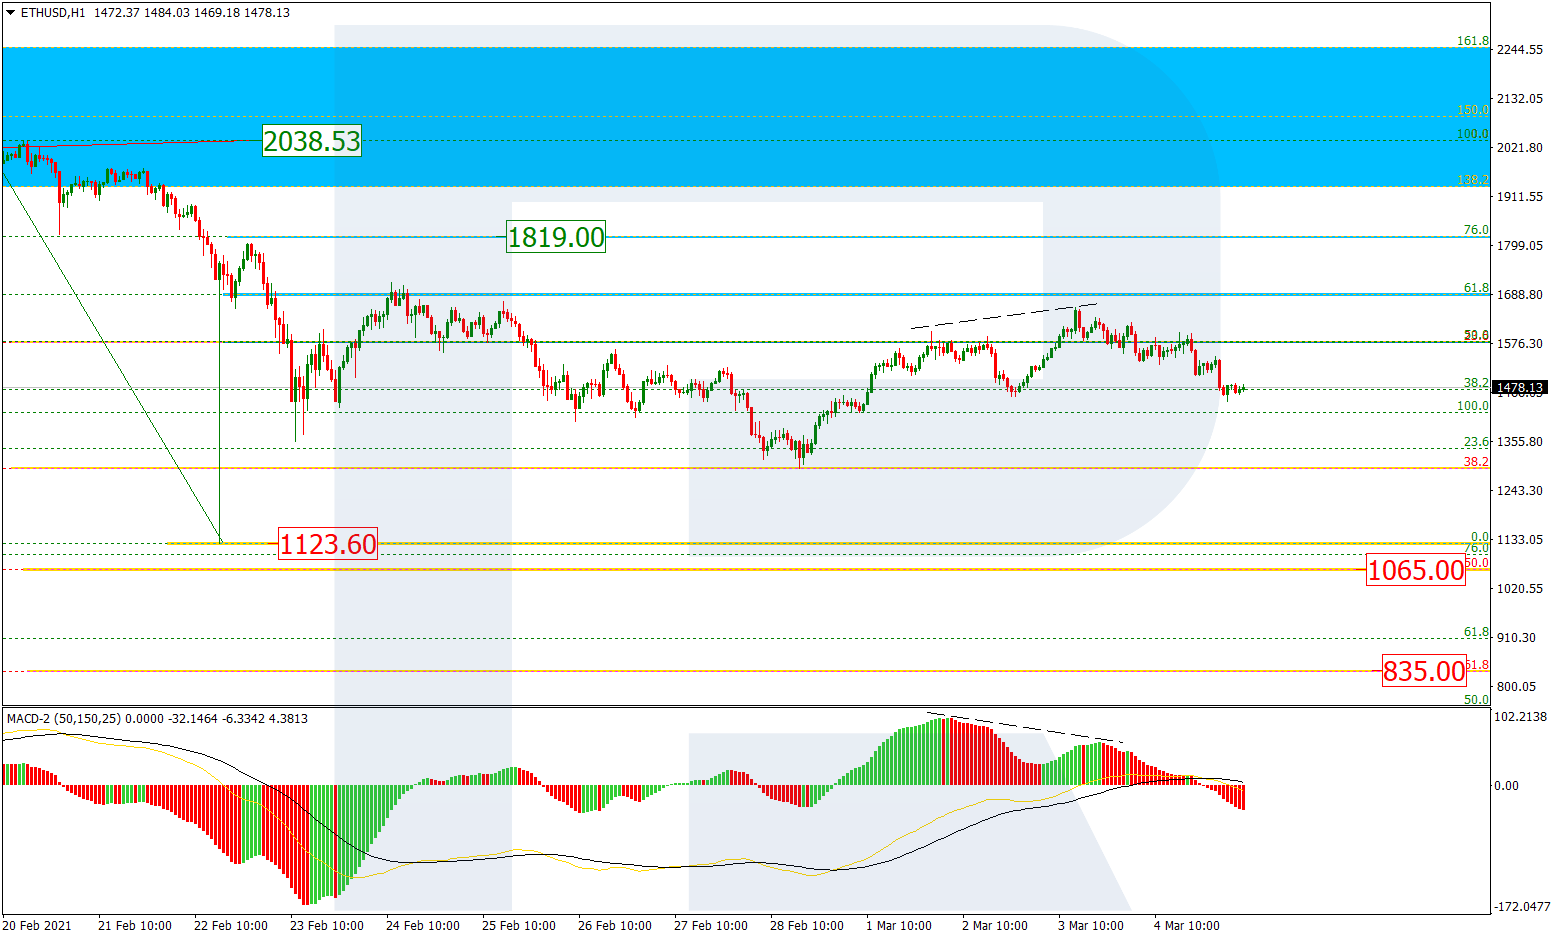
In the H1 chart, the divergence on MACD made the pair start a new short-term decline, which is getting close to 38.2% fibo at 186.00. Later, the decline may continue towards 50.0% and 61.8% fibo at 182.50 and 178.95 respectively. The resistance is at 197.37.

