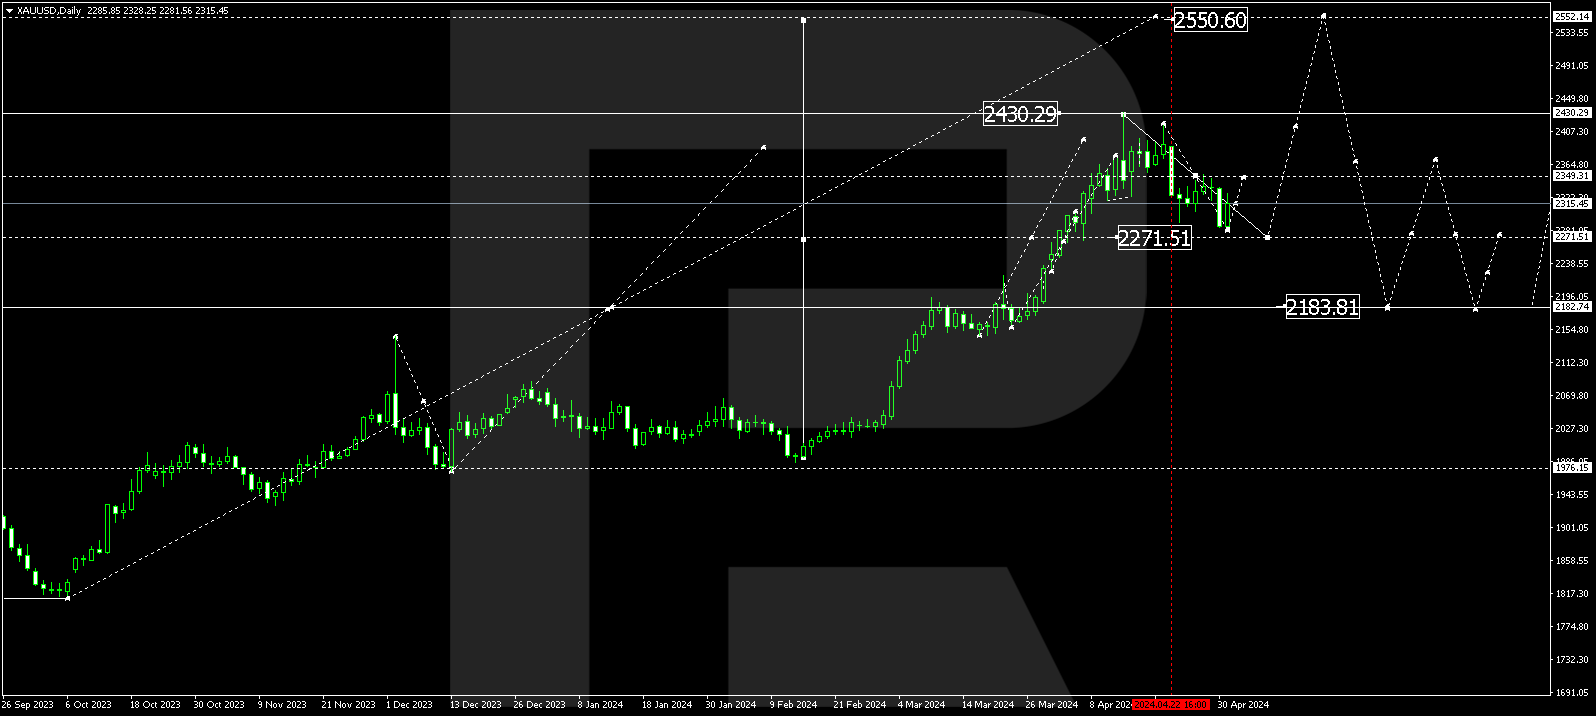
XAUUSD, “Gold vs US Dollar”
As we can see in the daily chart, after finally breaking the sideways channel to the downside and retesting 61.8% fibo, the pair has updated the low. The next downside targets are 76.0% fibo at 1438.05 and the fractal low at 1400.49. The descending MACD indicator confirms further decline.

In the H1 chart, there is a convergence on MACD, which may indicate a short-term pullback. the targets of this possible correction may be 23.6%, 38.2%, and 50.0% fibo at 1470.28, 1479.00, and 1486.08 respectively.

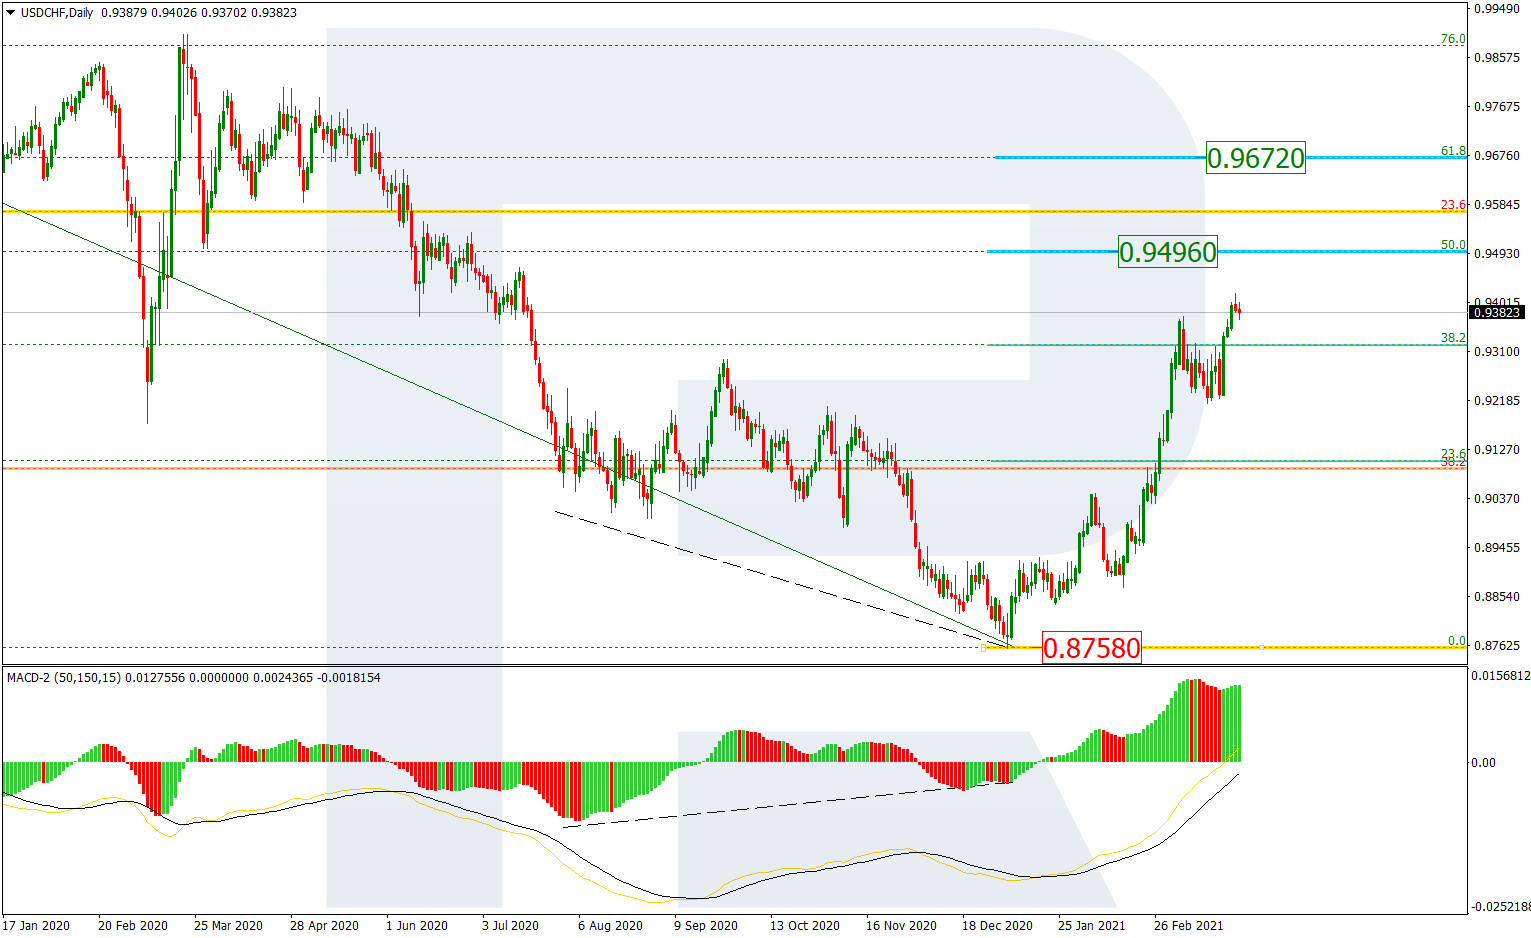
USDCHF, “US Dollar vs Swiss Franc”
As we can see in the daily chart, after failing to break the fractal low, the pair started another ascending impulse, which has already broken the local high. In this case, USDCHF is expected to grow towards the high at 1.0028, break it, and then continue trading upwards to reach long-term 76.0% fibo at 1.0098. However, if the market fails to break the high, the instrument may resume moving to the downside and reach 61.8% and 76.0% fibo at 0.9800 and 0.9748 respectively.
In the H1 chart, there is a divergence on MACD, which may indicate a possible pullback. The downside correctional targets may be 23.6%, 38.2%, and 50.0% fibo at 0.9949, 0.9929, and 0.9914 respectively. The resistance is the high at 0.9979.
