BTCUSD, “Bitcoin vs US Dollar”
As we can see in the H4 chart, after attempting to reach the high at 13857.20, BTCUSD is forming a new descending wave, which may test 38.2% fibo at 9840.00 again, thus continuing the correction. The next downside targets may be 50.0% and 61.8% fibo at 860.00 and 7370.00 respectively.


The H1 chart shows more detailed structure of the current descending wave after the divergence. By now, it has already reached 61.8% and, after a slight pullback, may continue moving towards 76.0% fibo at 10520.00. The key downside target is the low at 9666.00.

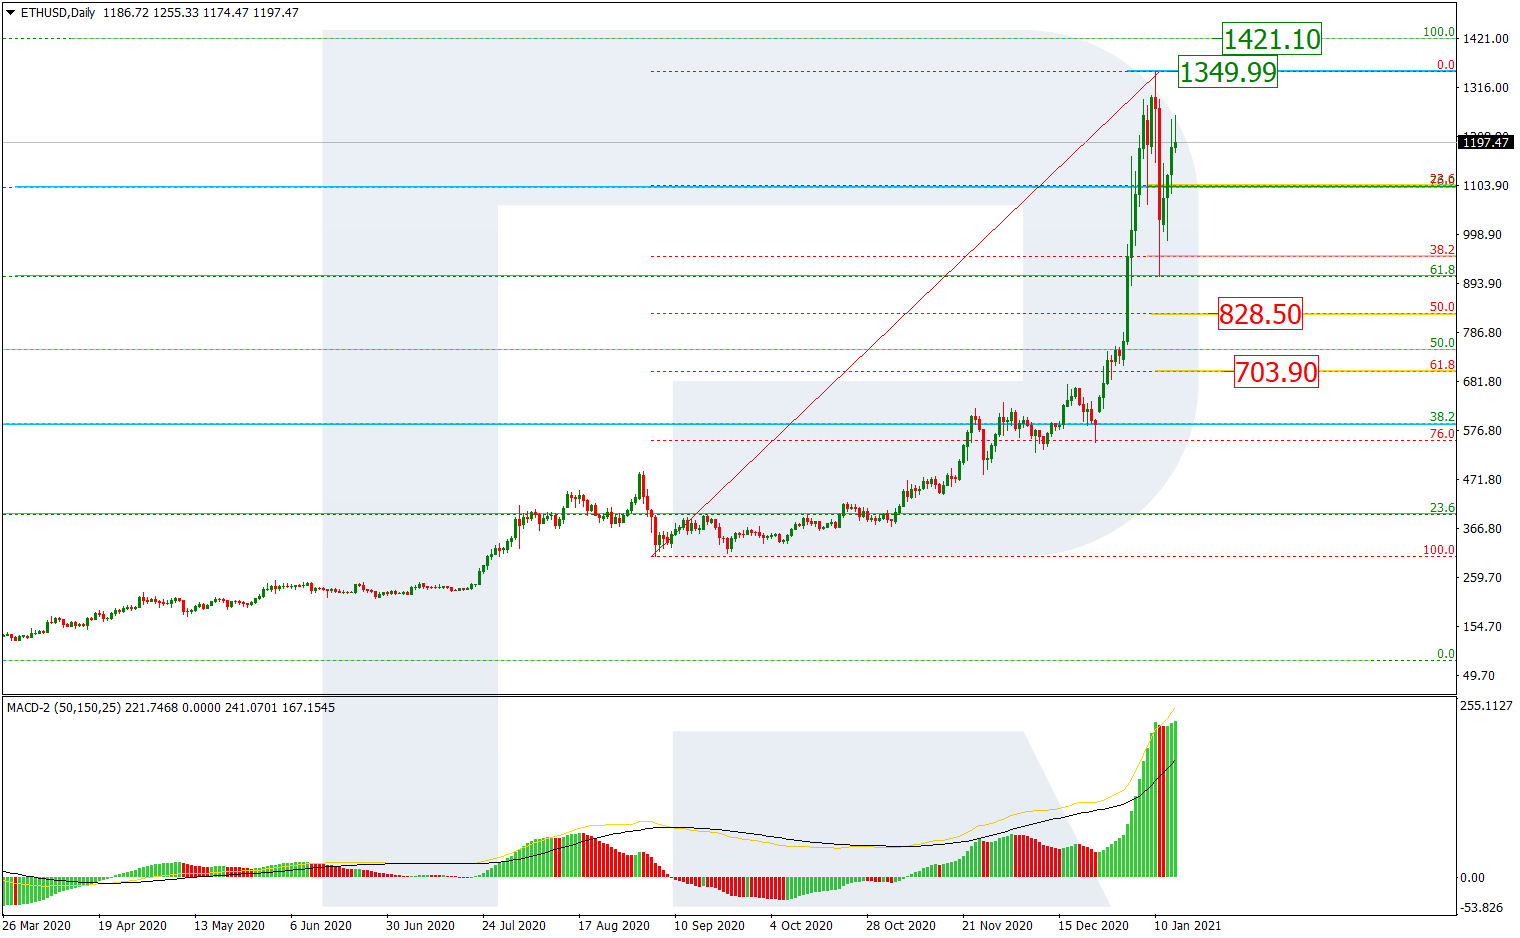
As we can see in the daily chart, ETHUSD is still being corrected to the downside and has already reached 38.2% fibo. The next downside targets may be 50.0% and 61.8% fibo at 231.50 and 200.80. The resistance is the high at 363.18
Эфириум (Ethereum) на дневном таймфрейме демонстрирует достижение очередным импульсом спада уровня 38,2%, продолжая развивать коррекционную фазу. Далее котировки могут снизиться к уровням 50,0% (231,50) и 61,8% (200,80) по Фибоначчи. Сопротивлением служит максимум - 363,18.
The H1 chart shows more detailed structure of the current descending channel. Right now, the pair continues testing 38.2% fibo.
