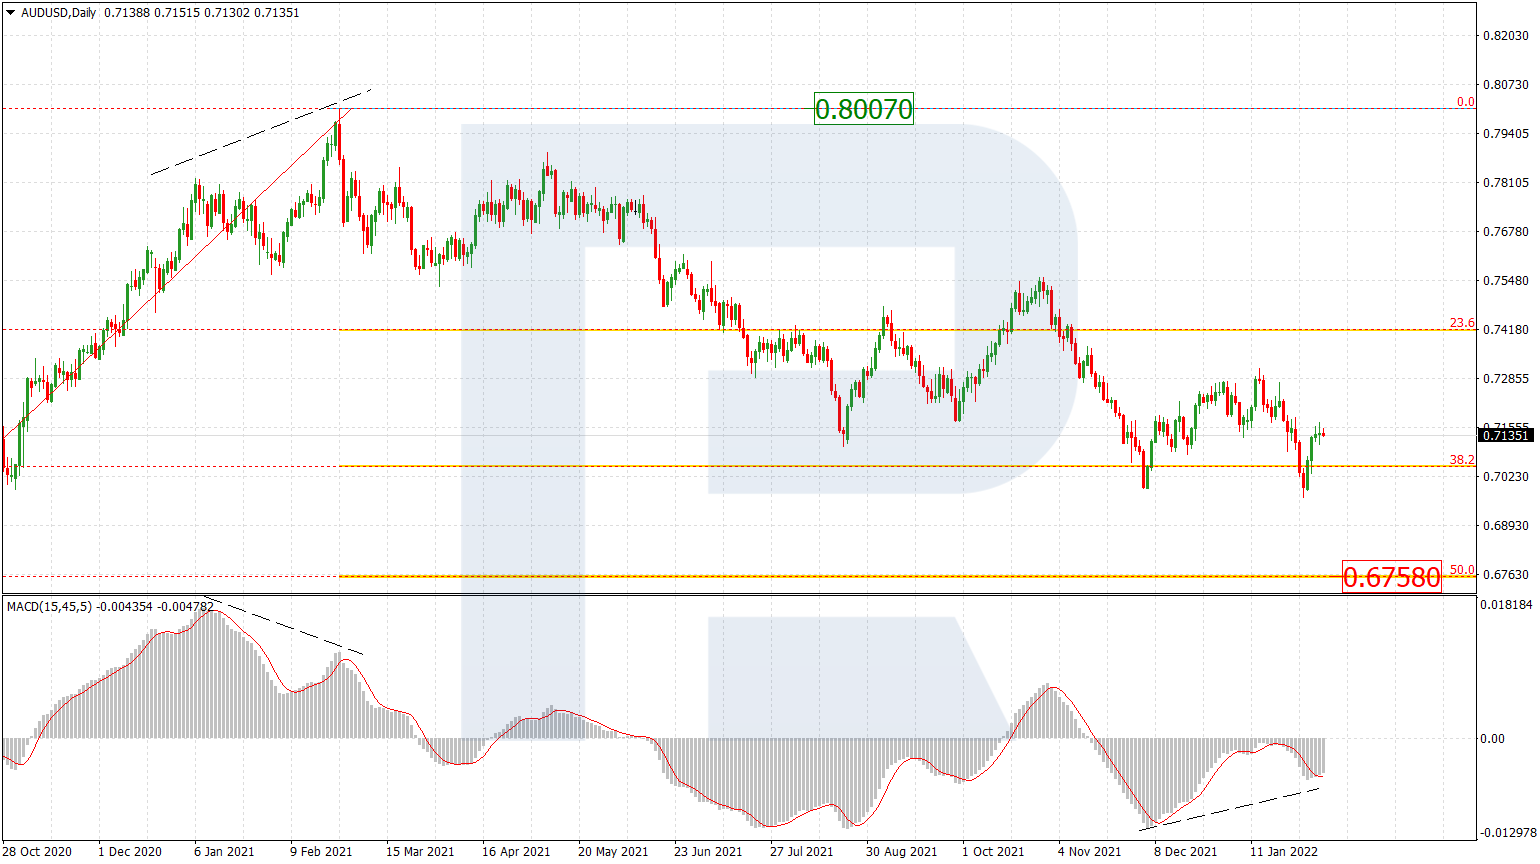
AUDUSD, “Australian Dollar vs US Dollar”
As we can see in the daily chart, the long-term rising tendency continues; the pair has already broken 38.2% fibo and right now it trying to fix above it to continue growing towards 50.0% fibo at 0.8292. However, at the same time, there is a divergence on MACD, which may indicate a possible pullback soon. The support is at 23.6% fibo (0.6820).

The H4 chart a new descending pullback after a local divergence on MACD. The first correctional wave may be heading towards 23.6% fibo at 0.7624 and then 38.2%, 50.0%, and 61.8% fibo at 0.7504, 0.7405, and 0.7397 respectively. However, if the asset completes the pullback and breaks the high at 0.7820, AUDUSD may continue growing to enter the post-correctional extension area between 138.2% and 161.8% fibo at 0.7880 and 0.7917 respectively.

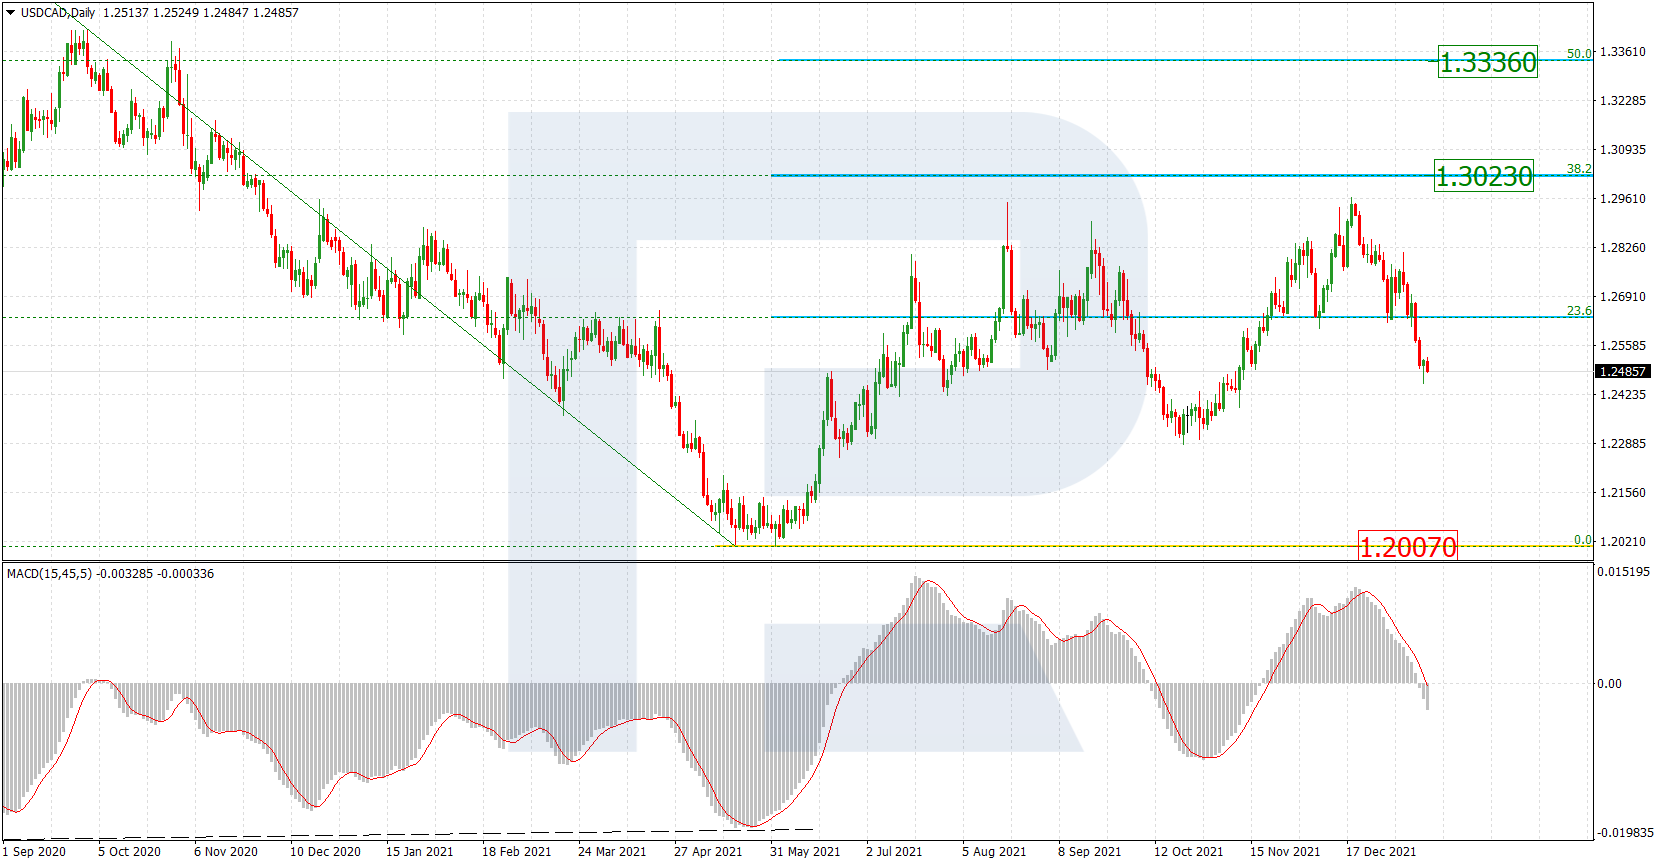
USDCAD, “US Dollar vs Canadian Dollar”
As we can see in the daily chart, USDCAD continues trading downwards and has already reached 76.0% fibo. In this case, the next downside target may be close to the fractal low at 1.2061. At the same time, there is a convergence on MACD, which may hint at a new pullback towards the resistance at 61.8% fibo (1.3057).
In the H4 chart, a convergence on MACD made the pair complete its local correction at 23.6% fibo and start a new descending wave continue the downtrend towards the post-correctional extension area between 138.2% and 161.8% fibo at 1.2552 and 1.2503 respectively after breaking the low at 1.2630. At the same time, one shouldn’t exclude a rebound from the low and a breakout of the resistance at 1.2835. In this case, the price may continue the correction to reach 38.2% and 50.0% fibo at 1.2921 and 1.3010 respectively.
