BTCUSD, “Bitcoin vs US Dollar”
The H4 chart shows a steady rising tendency. After BTCUSD had reached 50.0% fibo, there was a divergence on MACD, which made the pair resume falling. The support is at 38.2% fibo (9263.40). after completing the correction, the instrument may start a new rising impulse towards 61.8% and 76.0% fibo at 11010.00 and 12074.00 respectively.


The H1 chart shows a new decline after the divergence. The downside targets are 23.6%, 38.2%, and 50.0% fibo at 9965.90, 9632.60, and 9361.00 respectively. The resistance is the high at 10505.60.

ETHUSD, “Ethereum vs. US Dollar”
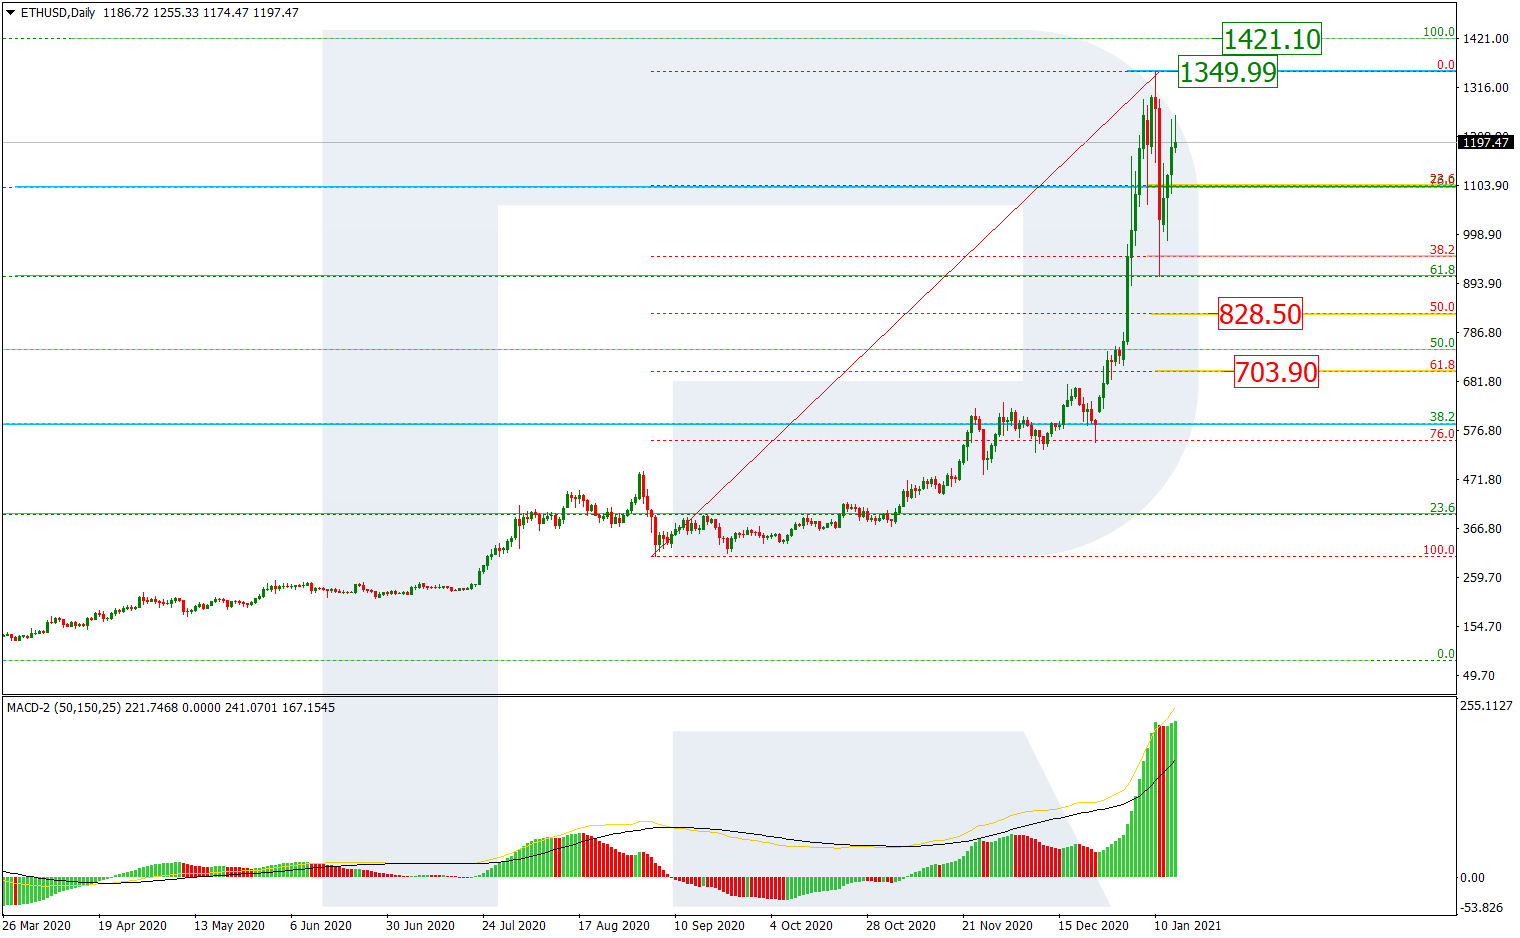
As we can see in the daily chart, ETHUSD is moving inside the uptrend, which has already reached 61.8% fibo. The next upside target may be 76.0% fibo at 303.60. right now, there are no signals for a pullback, but it may be forced by a quick descending impulse and a new rising impulse after that. The support is 38.2% fibo at 210.50.
The H1 chart shows a new descending pullback after the divergence. The pair has already reached 23.6% fibo and may later continue falling towards 38.2% and 50.0% fibo at 254.40 and 247.30 respectively. the resistance is the high at 277.90.
