BTCUSD, “Bitcoin vs US Dollar”
The H4 chart hasn’t changed much over the past week. The descending wave was followed by new growth. In the nearest future, BTCUSD may fall to reach 50.0% and 61.8% fibo at 10477.00 and 10085.00 respectively in order to extend the correction. After finishing the correction, the next rising wave may be heading to break the high at 12137.00 and then continue trading upwards to reach the fractal high at 13857.00.


In the H1 chart, the pair is correcting to the upside after completing another descending impulse, which reached 50.0% fibo. After finishing the correction, the pair may resume growing towards 61.8% fibo at 10885.00. If the asset breaks this level, the instrument may continue trading upwards to reach 50.0% and 61.8% fibo at 10477.00 and 10085.00 respectively.


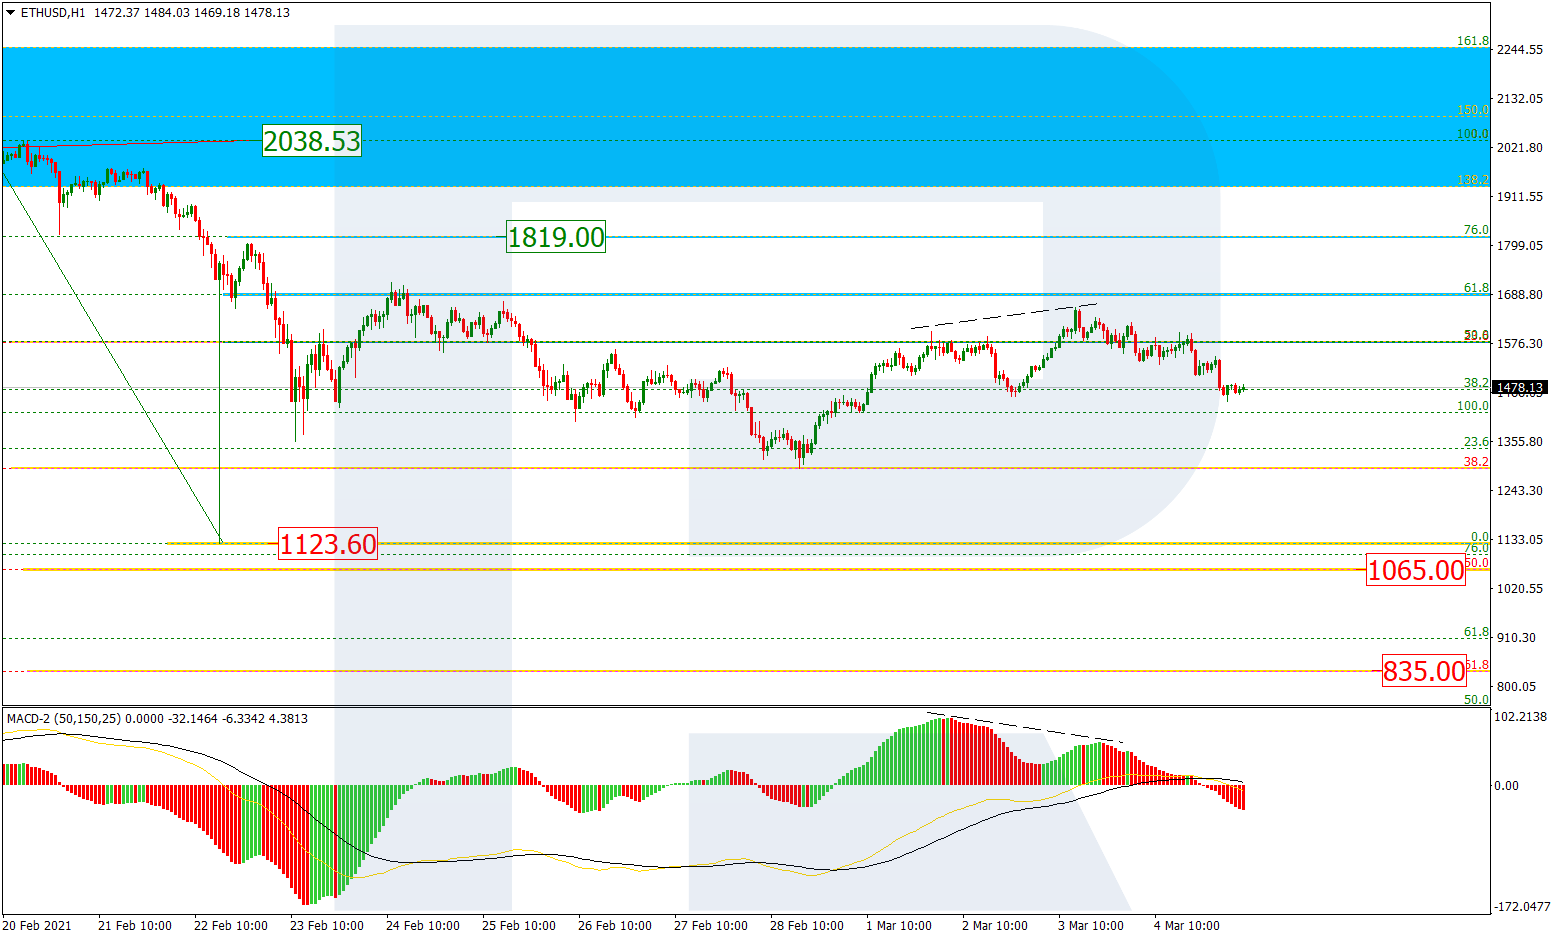
ETHUSD, “Ethereum vs. US Dollar”
As we can see in the H4 chart, after testing and breaking 23.6% fibo, Ethereum has finished the correction by updating its previous high. The next upside targets are inside the post-correctional extension area between 138.2% and 161.8% fibo at 450.05 and 471.30 respectively. The support is at 323.97.


In the H1 chart, after breaking the high, the pair is starting a pullback to test it from above. The upside targets are inside the post-correctional extension area between 138.2% and 161.8% fibo at 450.05 and 471.30 respectively.

