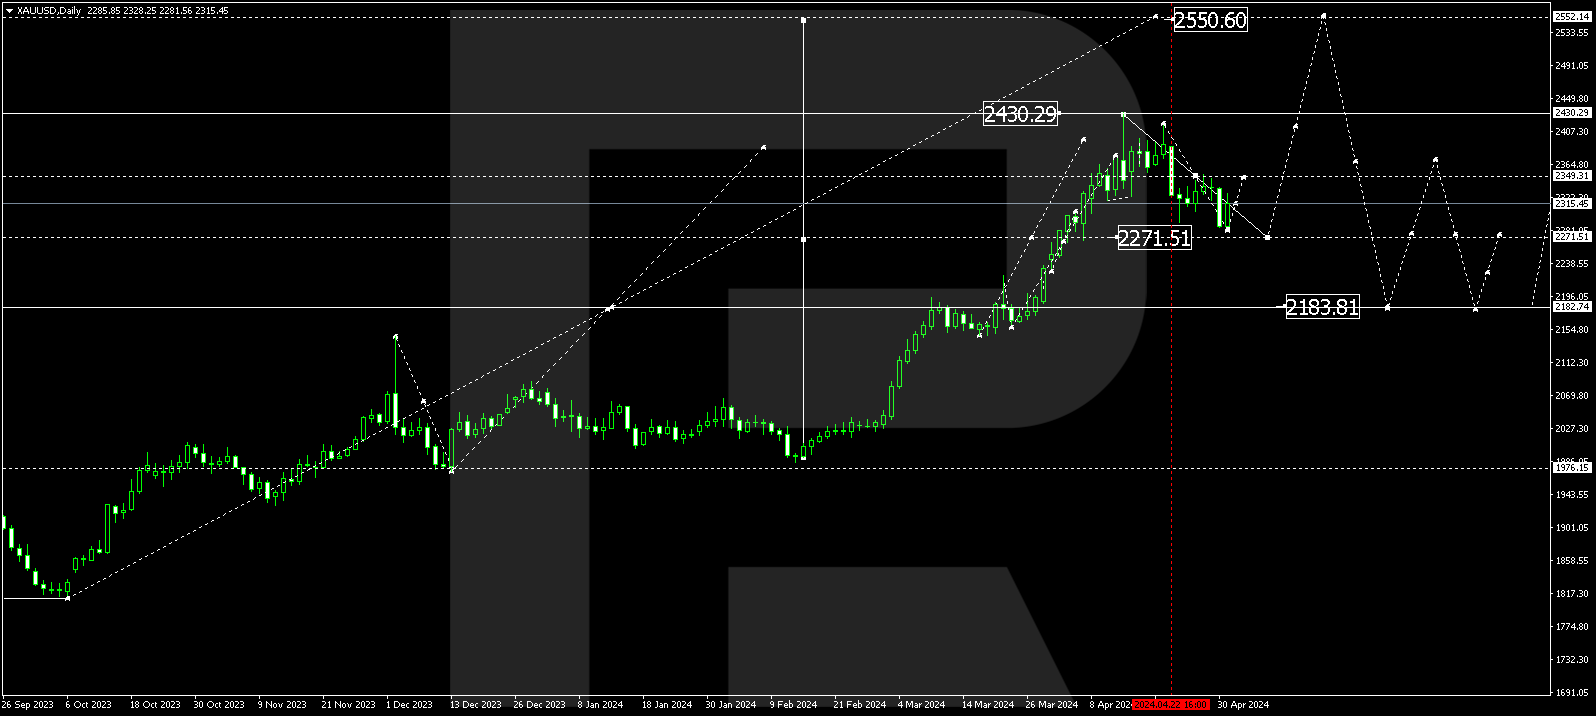
XAUUSD, “Gold vs US Dollar”
In the daily chart, after attempting to fall and reach 50.0% fibo at 1617.50, the asset is starting a new rising pullback. However, there is a convergence on MACD, which may indicate that this pullback might as well transform into a proper ascending wave to reach the high at 2074.75. However, the correction is in the very beginning, that’s why one shouldn’t exclude a further downtrend.

The H4 chart shows a more detailed structure of the current correctional uptrend after a convergence on MACD. The possible correctional targets are 23.6%, 38.2%, and 50.0% fibo at 1743.45, 1785.00, and 1818.15 respectively. However, if the price breaks the local low at 1676.78, XAUUSD may continue falling to reach the long-term 50.0% fibo at 1617.50.

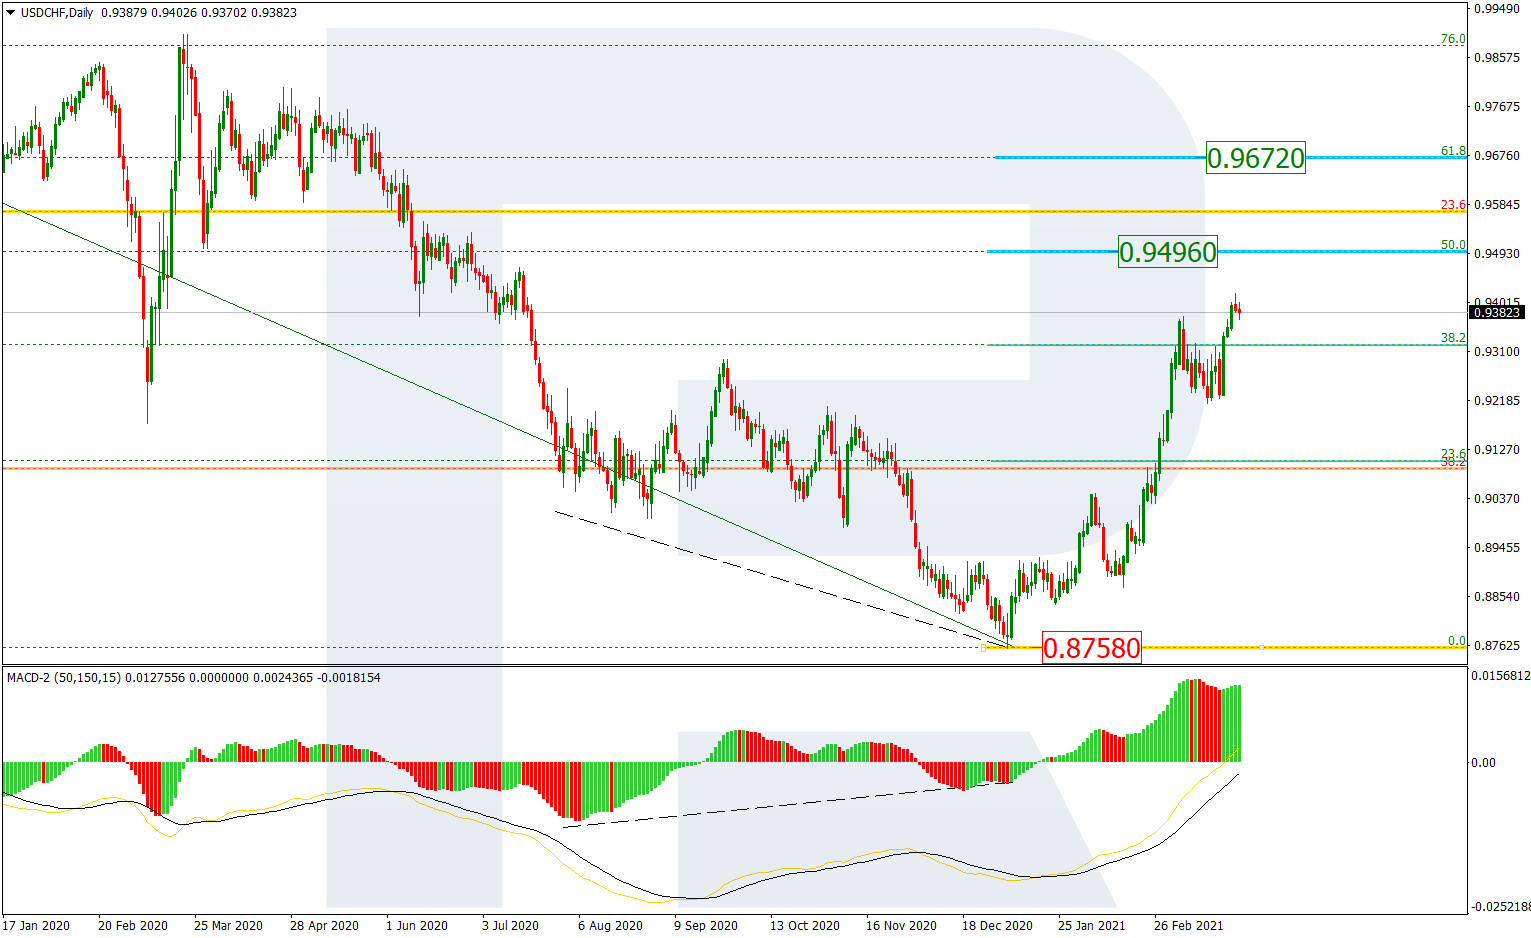
USDCHF, “US Dollar vs Swiss Franc”
The daily chart shows that after reaching a very important level, 38.2% fibo, USDCHF is starting a new correction downwards. Later, the market may continue growing towards 50.0% and 61.8% % fibo at 0.9496 and 0.9672 respectively. However, if the asset breaks the support at 0.8758, the correction may be over.
As we can see in the H4 chart, the first descending wave has reached 23.6% fibo. The next correctional targets may be 38.2% and 50.0% fibo at 0.9183 and 0.9123 respectively. The resistance is the local high at 0.9376.
