GBPUSD, “Great Britain Pound vs US Dollar”
As we can see in the H4 chart, after finishing the correctional uptrend, GBPUSD is forming a new descending wave to break the low at 1.2865. After that, the instrument may continue falling to reach the retracement of 61.8% at 1.2774 and then the post-correctional extension area between the retracements of 138.2% and 161.8% at 1.2746 and 1.2673 respectively. The resistance level is the local high 1.3176.


In the H1 chart, the pair is trading to reach the low at 1.2865. At the same time, there is a convergence on MACD, which may indicate a new pullback. The possible correctional targets may be the retracements of 23.6%, 38.2%, and 50.0% at 1.2940, 1.2984, and 1.3020 respectively.

EURJPY, “Euro vs. Japanese Yen”
As we can see in the H4 chart, EURJPY is still trading downwards and has already reached the retracement of 50.0%. The next target may be the retracement of 61.8% at 121.61. At the same time, there is a convergence on MACD, which may indicate a possible pullback. The resistance level is the retracement of 23.6% at 125.25.

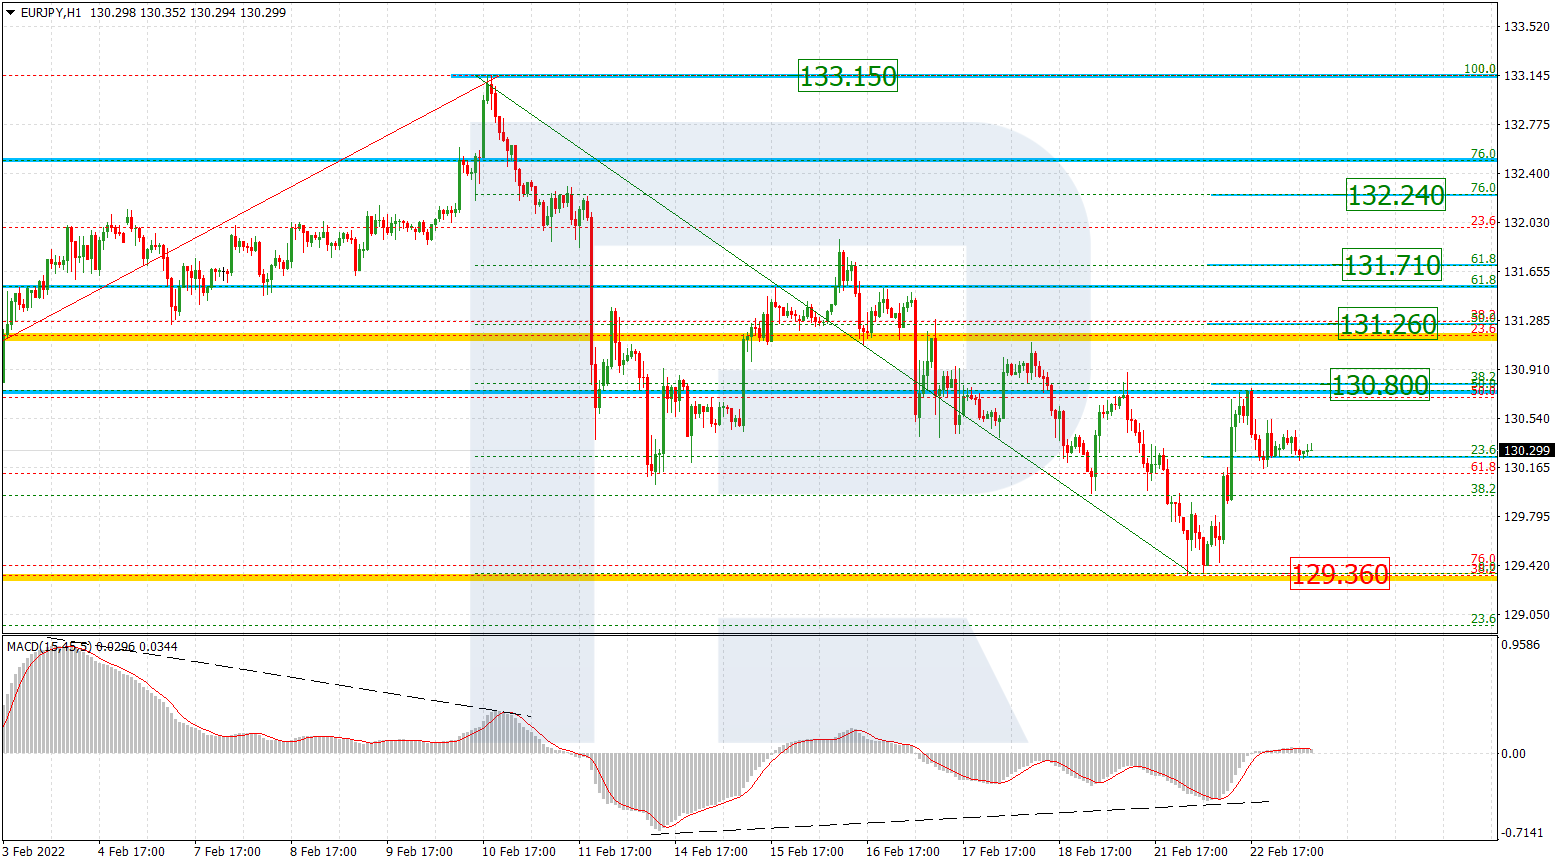
In the H1 chart, the convergence made the pair start a new sideways movement, which has already reached the retracement of 23.6%. The next targets of this pullback may be the retracements of 38.2% and 50.0% at 124.13 and 124.64 respectively.