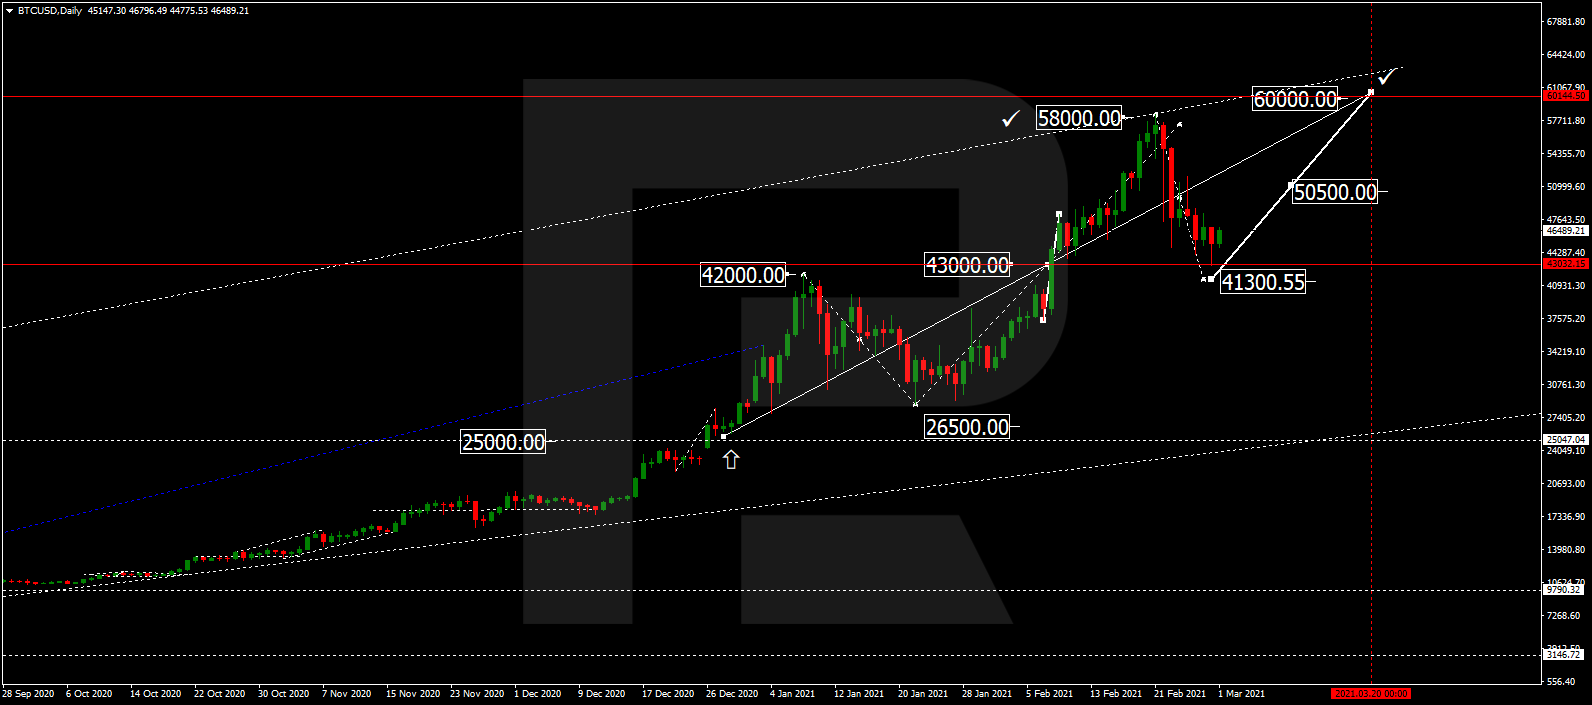
BTCUSD, “Bitcoin vs US Dollar”
As we can see in the daily chart, after testing 23.6% fibo at 11350.00, BTCUSD failed to continue this rising impulse and started a new descending wave towards 50.0% and 61.8% fibo at 8600.00 and 7350.00 respectively.

In the H4 chart, the pair is about to complete the short-term pullback, which may be followed by a new descending impulse to reach 50.0% fibo at 8600.00. The resistance is at 11350.00.

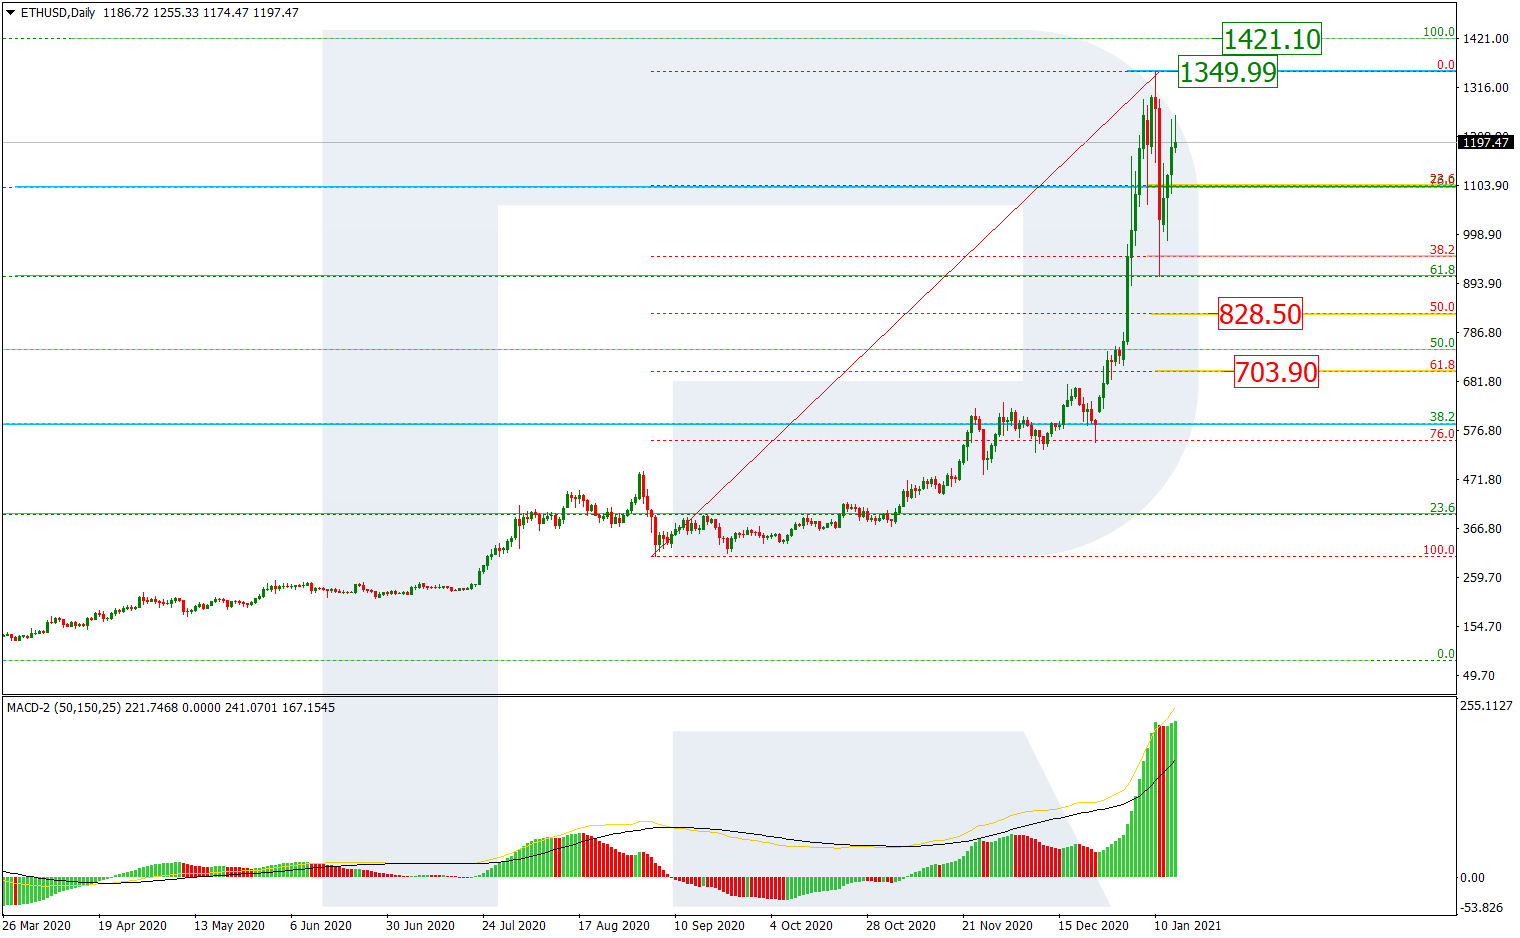
ETHUSD, “Ethereum vs. US Dollar”
As we can see in the daily chart, after testing 50.0% and 61.8% fibo, ETHUSD started forming a new descending impulse; the target is 76.0% fibo at 163.20. At the same time, there is a convergence, which may indicate a possible pullback. The resistance is 50.0% fibo at 231.50.
In the H4 chart, the instrument is quickly falling and getting closer to 76.0% fibo at 163.20.
