GBPUSD, “Great Britain Pound vs US Dollar”
In the H4 chart, after completing the correction at 61.8% fibo (1.3116), GBPUSD is forming another rising impulse towards the high at 1.3539. If the price breaks the high, it may continue trading upwards to reach the long-term 76.0% fibo at 1.3664 and the post-correctional extension area between 138.2% and 161.8% fibo at 1.3792 and 1.3980 respectively. The local support is at 1.2854.


The H1 chart shows a more detailed structure of the current ascending wave, which has already reached 76.0% fibo and may later continue towards the local post-correctional extension area between 138.2% and 161.8% fibo at 1.3639 and 1.3788 respectively. the short-term support is the fractal low at 1.3134.

EURJPY, “Euro vs. Japanese Yen”
In the H4 chart, the situation hasn’t changed much. EURJPY has stopped growing not far from the high at 127.07. After breaking the high, the asset may continue growing towards the mid-term 61.8% fibo at 128.65 and then the post-correctional extension area between 138.2% and 161.8% fibo at 129.15 and 130.40 respectively. The key support remains at the fractal low at 121.62.

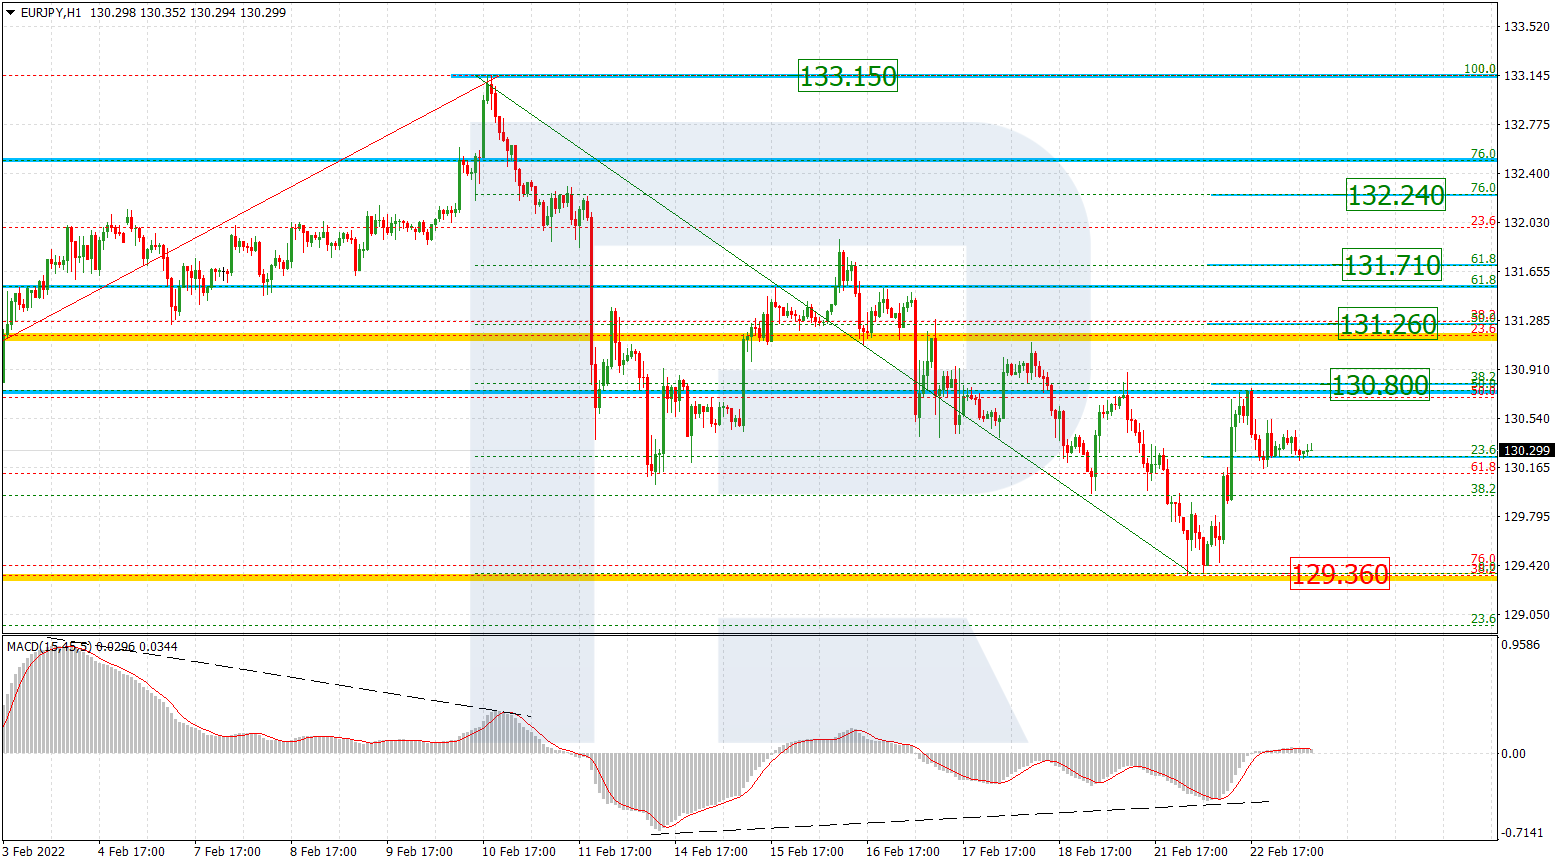
As we can see in the H1 chart, the asset is moving inside the same post-correctional extension area between 138.2% and 161.8% fibo at 126.02 and 126.56 respectively. However, this decline is a part of the correction that started after a divergence on MACD. The correctional downtrend has already tested 23.6% fibo twice and, after breaking it, may continue falling towards 38.2% and 50.0% fibo at 125.25 and 124.79 respectively. A breakout of the local high at 126.74 will hint at further uptrend.