Brent
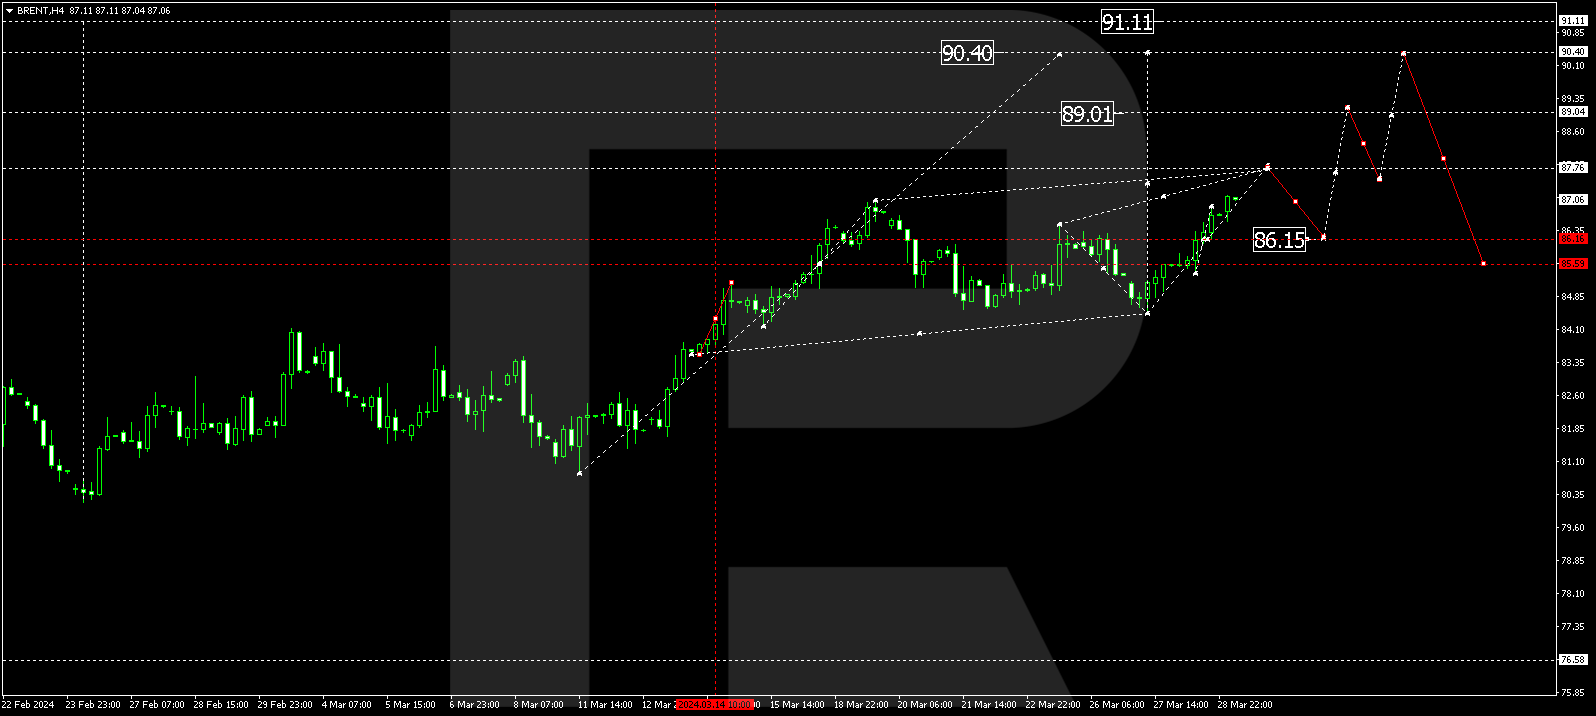
As we can see in the H4 chart, divergence on MACD made the asset start a new correctional decline after entering the post-correctional extension area between 138.2% and 161.8% fibo at 94.54 and 99.43 respectively. A breakout of the key support at 65.89 will lead to a reversal of the long-term tendency.


The H1 chart shows the downside correctional targets – 23.6%, 38.2%, and 50.0% fibo at 90.65, 86.56, and 83.28 respectively. A breakout of the resistance at 97.27 will result in a further uptrend.


Dow Jones
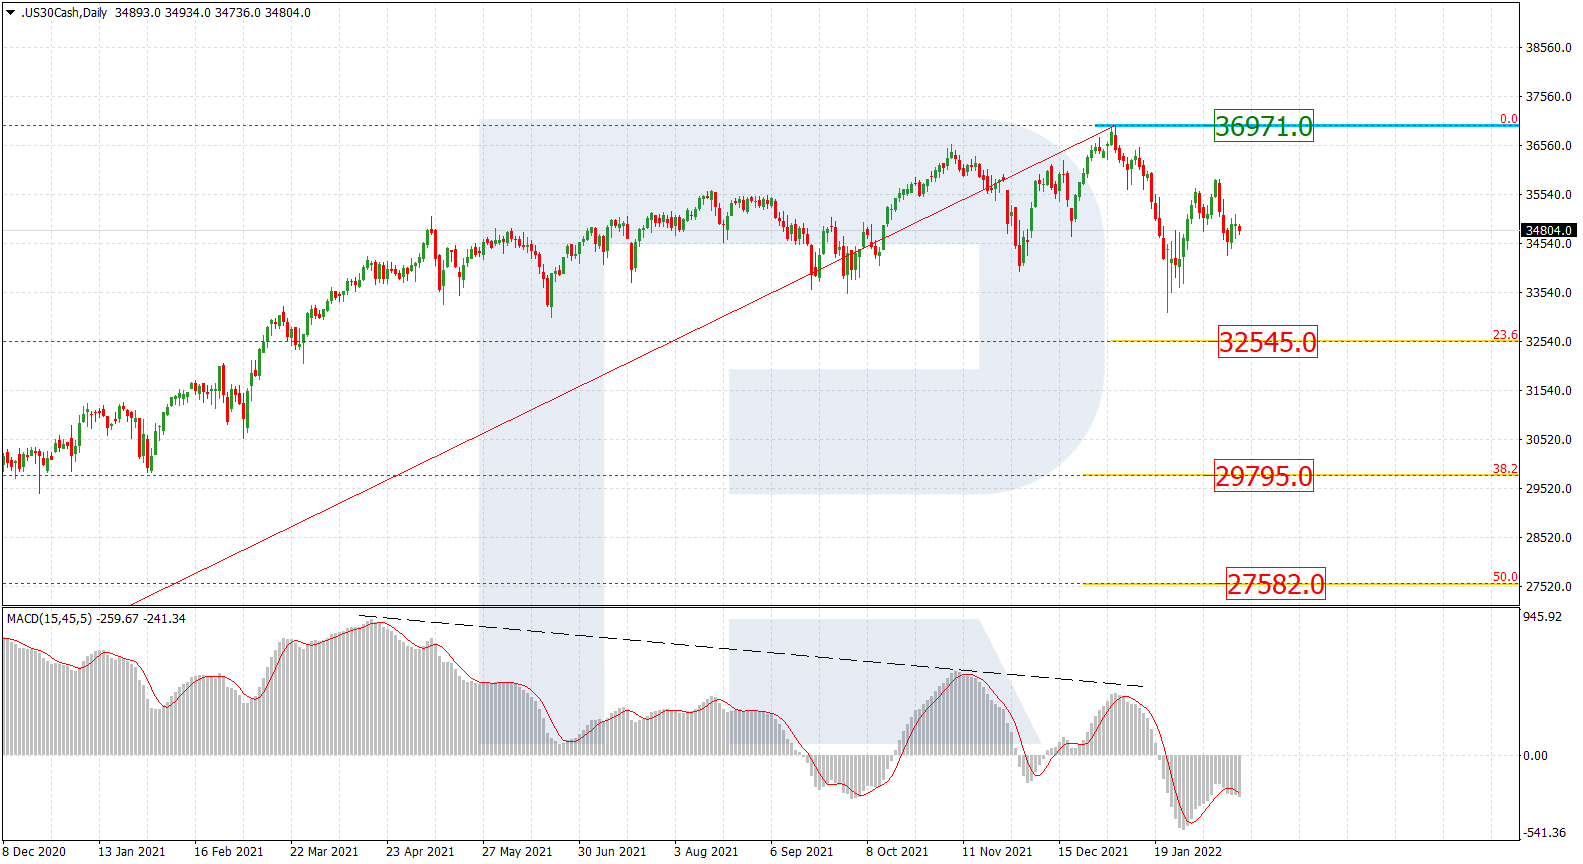
As we can see in the daily chart, the index is starting a new descending tendency or even reversing. After failing to reach the first downside target at 23.6% fibo at 32545.0, the asset formed a slight pullback, which was later followed by a new impulse to the downside. If the price breaks the above-mentioned target, it may continue falling to reach 38.2% and 50.0% fibo at 29795.0 and 27582.0 respectively. The key support is the high at 36971.0.


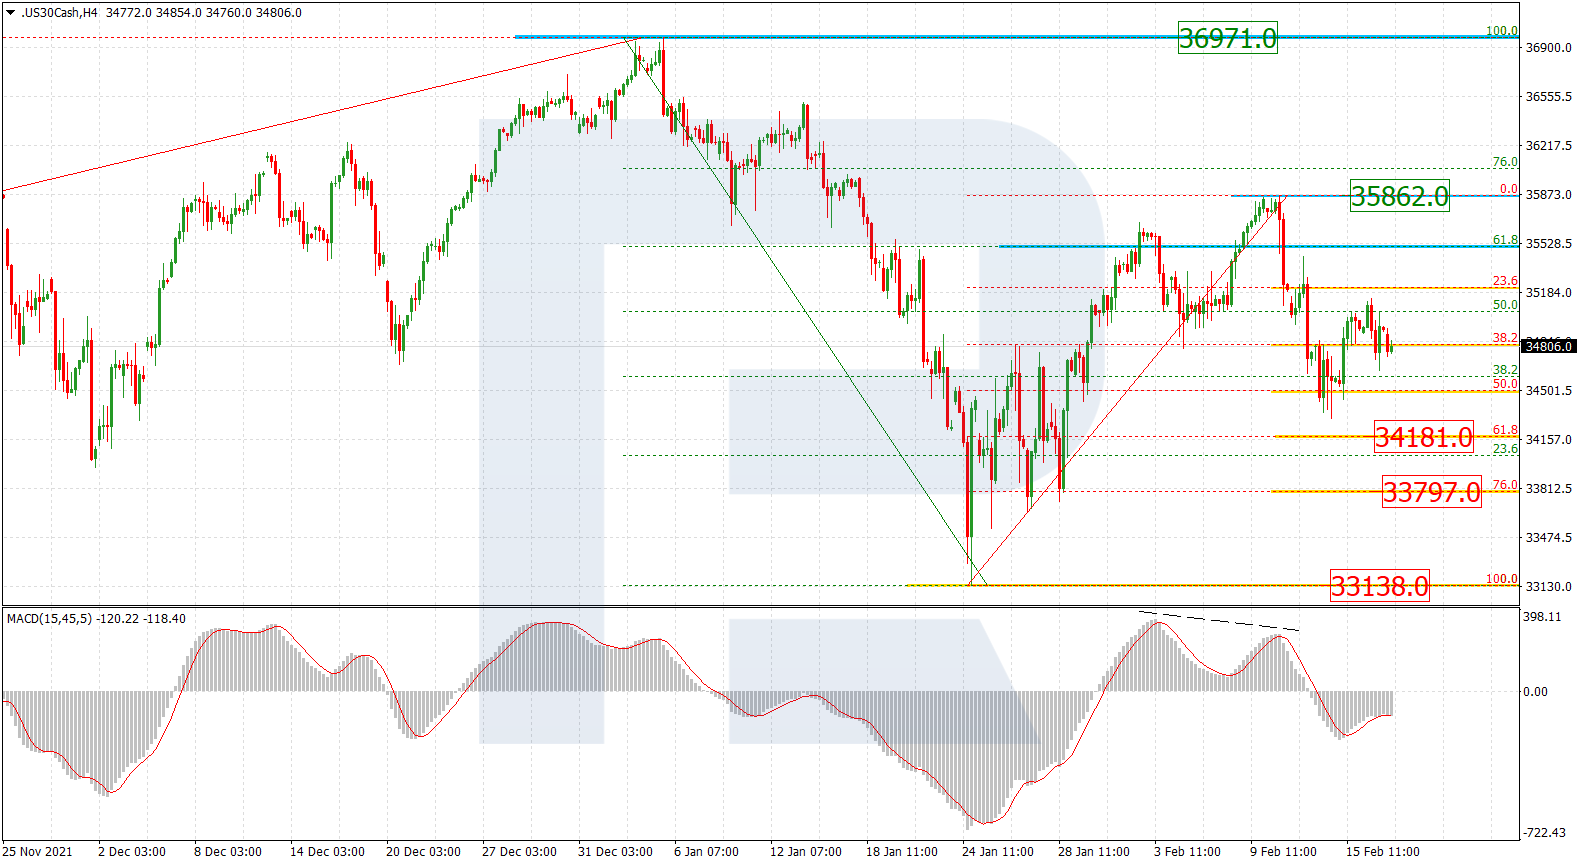
The H4 chart shows that the correctional uptrend, after breaking 61.8% fibo, failed to reach 76.0% fibo at 36050.0 and divergence on MACD made the pair fall to reach 50.0% fibo. The next downside targets may be 61.8% and 76.0% fibo at 34181.0 and 33797.0 respectively, as well as the low at 33138.0.

