BTCUSD, “Bitcoin vs US Dollar”
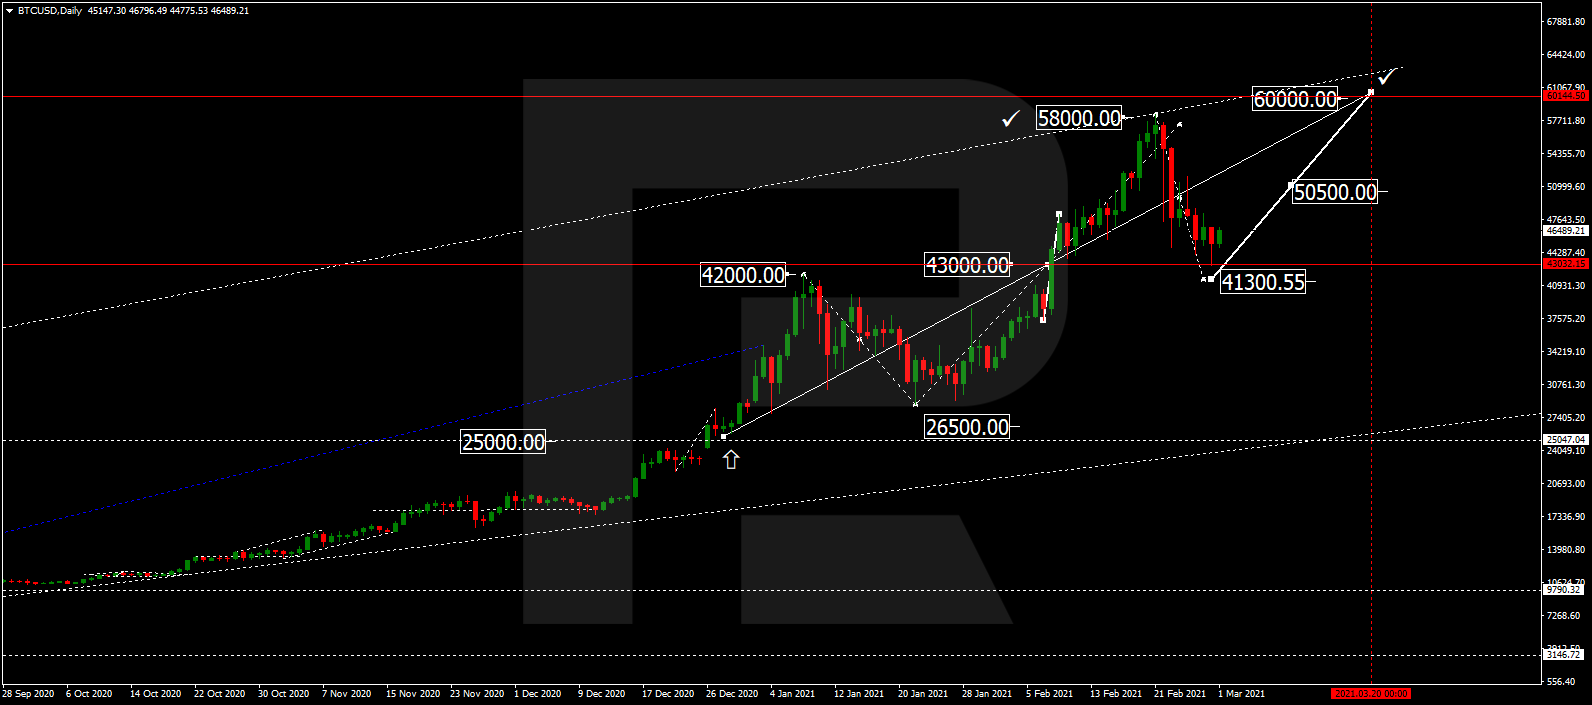
The daily chart has been showing the same technical picture as the week before. Bitcoin is falling to re-test 23.6% fibo after failing to reach the high at 10368.40. In the nearest future, the asset is expected to resume falling towards 38.2%, 50.0%, and 61.8% fibo at 7907.00, 7150.00, and 6390.00 respectively.


As we can see in the H1 chart, the divergence made the pair stop growing at the mid-term 38.2% fibo and start a new downtrend, which has already reached 61.8% fibo and may continue towards 76.0% fibo at 8927.10 and then the low at 8814.20.


ETHUSD, “Ethereum vs. US Dollar”
As we can see in the H4 chart, Ethereum is forming the mid-term correction between 23.6% fibo and the high at 214.90 and 253.47 respectively. The most probable scenario implies that the price may break 23.6% fibo and continue trading downwards to reach 38.2% and 50.0% fibo at 191.00 and 171.60 respectively.


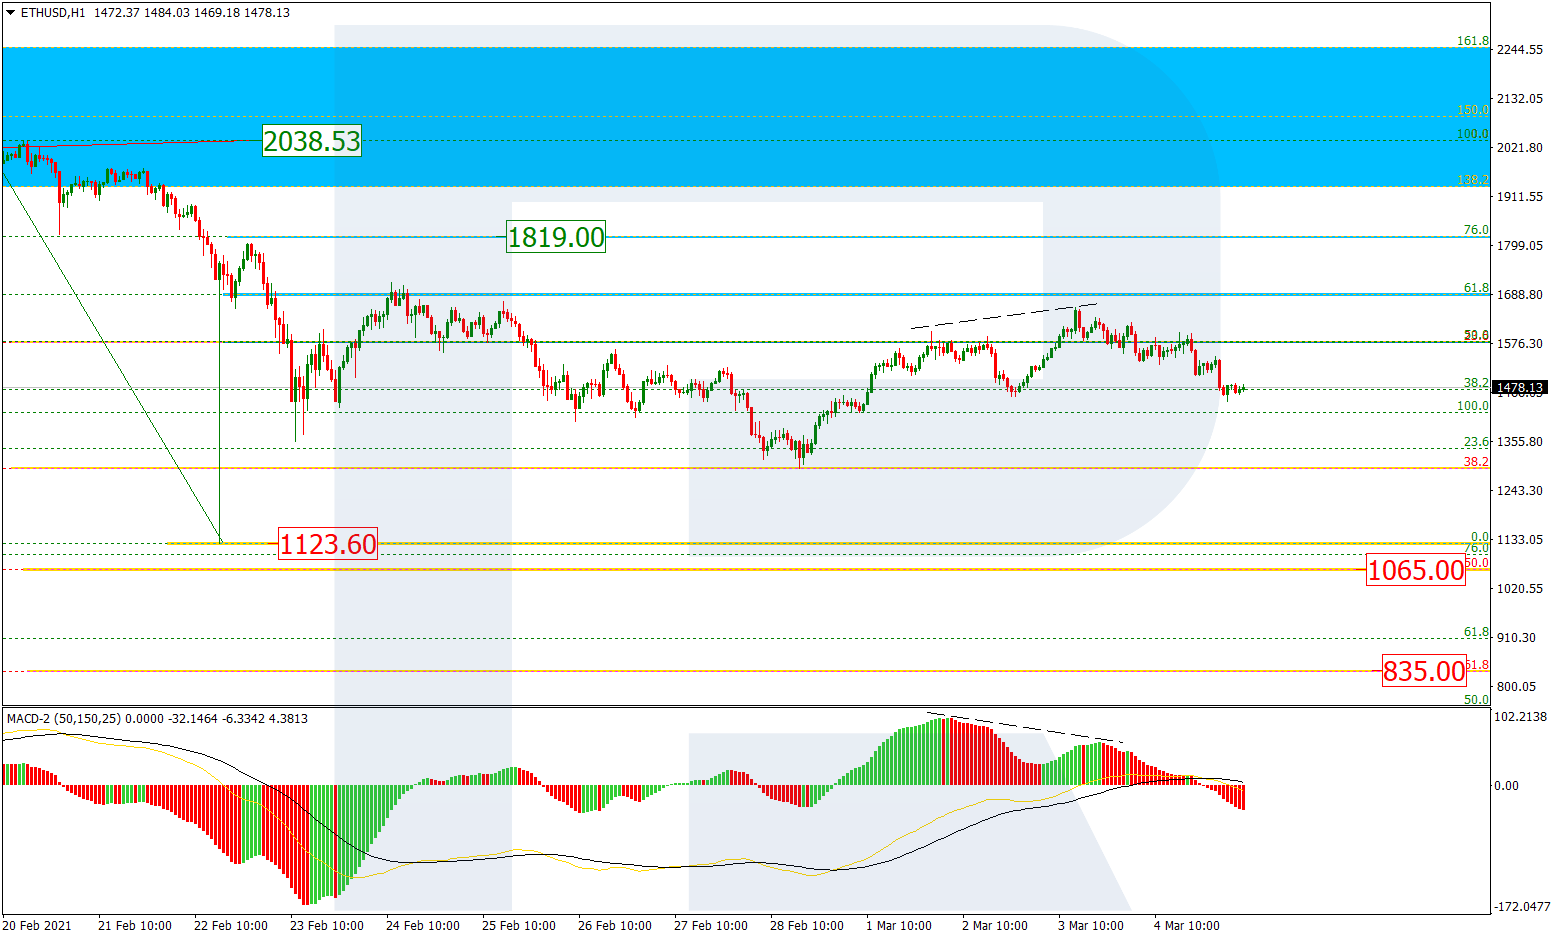
In the H1 chart, the divergence on MACD made the pair start a new descending wave, which has already reached 50.0% fibo. Later, the market may continue falling towards 61.8% and 76.0% fibo at 228.50 and 223.80 respectively and then the low at 215.90. The resistance is the high at 248.89.

