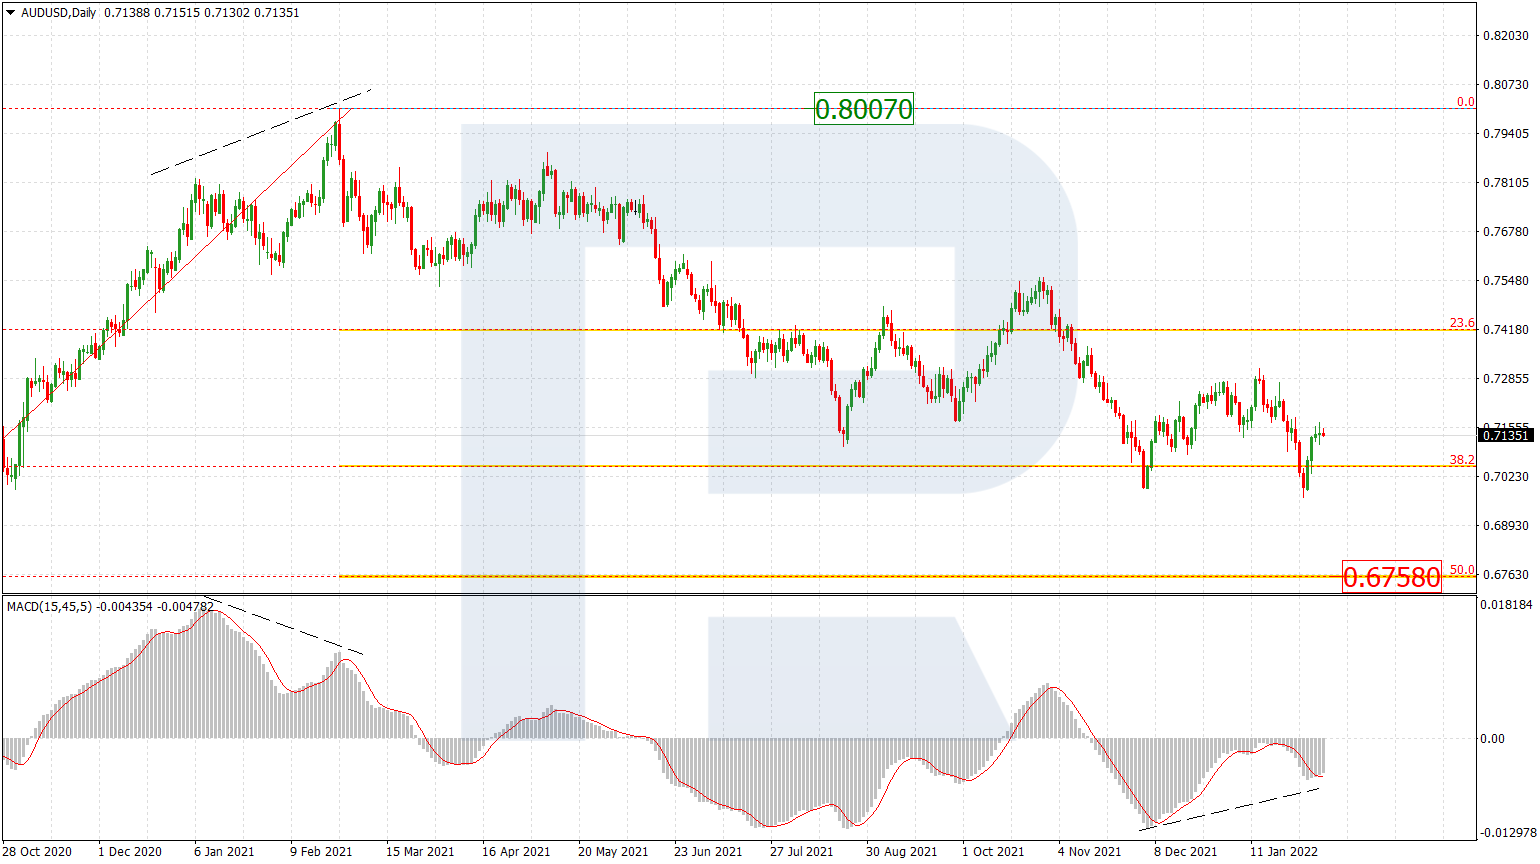
AUDUSD, “Australian Dollar vs US Dollar”
As we can see in the daily chart, the long-term uptrend continues. AUDUSD is forming another rising wave, which is approaching the long-term 38.2% fibo at 0.7634. The next upside target may be 50.0% fibo at 0.8292. However, one can see a divergence on MACD, which may hint at a new pullback towards the support area at 23.6% fibo (0.6820).

In the H4 chart, AUDUSD is entering the post-correctional extension area between 138.2% and 161.8% fibo at 0.7574 and 0.7675 respectively. At the same time, there is a divergence on MACD, which may indicate a possible pullback after the asset reaches its long-term upside target. The pullback may head towards 23.6%, 38.2%, and 50.0% fibo at 0.7482, 0.7388 and 0.7312 respectively.

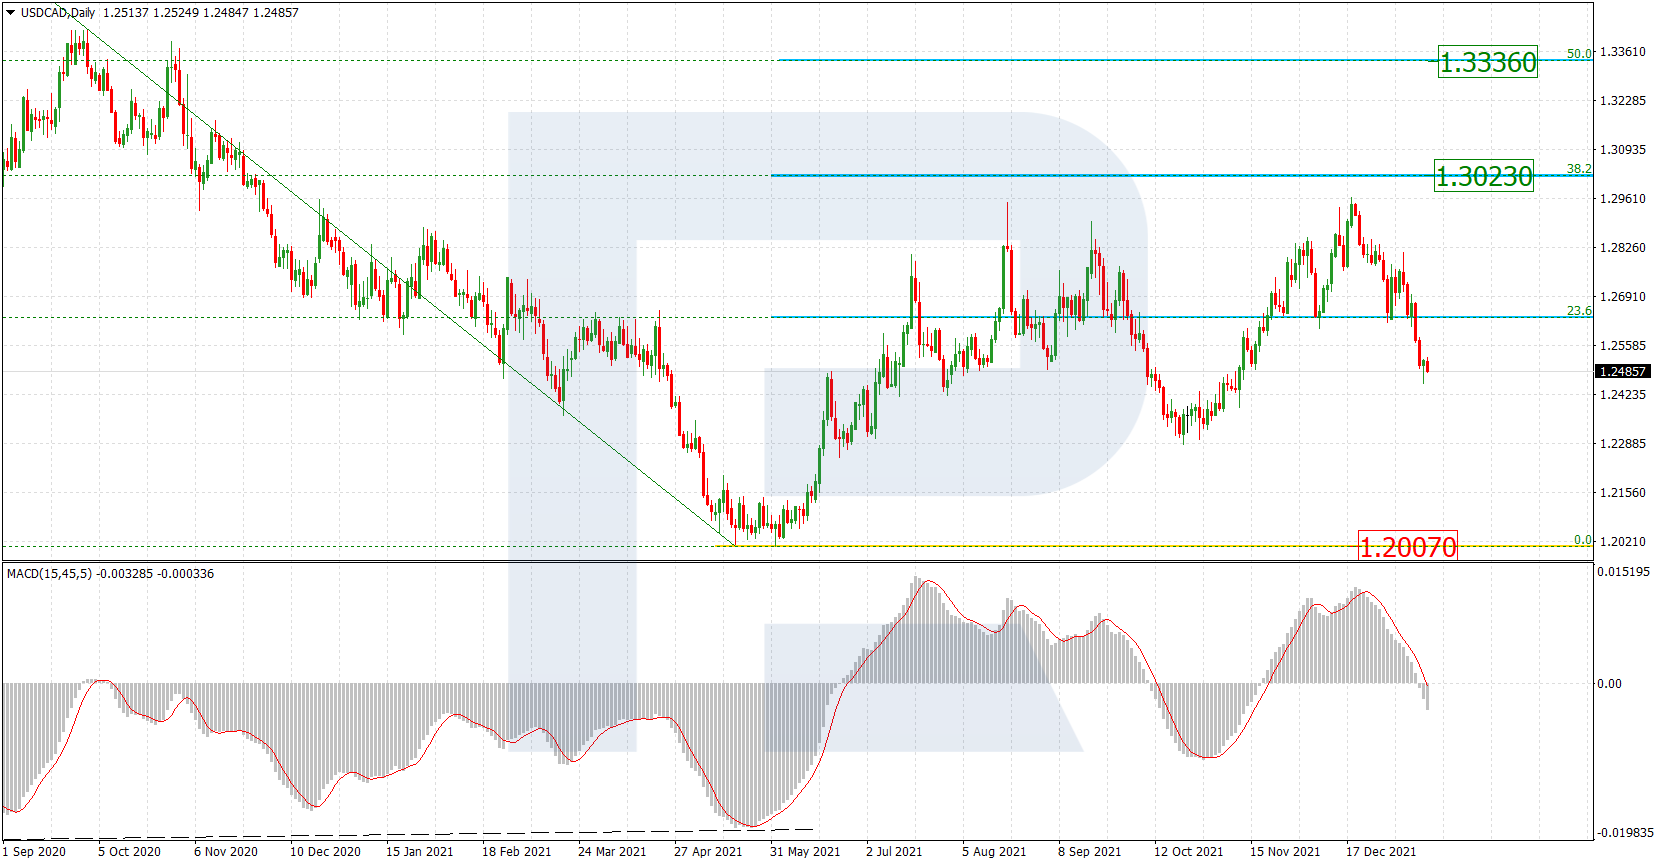
USDCAD, “US Dollar vs Canadian Dollar”
As we can see in the daily chart, USDCAD has reached 76.0% fibo. A pretty significant level. The next target of the dominating tendency may be the fractal at 1.2061. At the same time, there is a convergence on MACD, which may hint at a new pullback towards 50.0% fibo at 1.3365.
In the H4 chart, after reaching the target and a convergence on MACD, the pair is returning to the previous post-correctional extension area between 138.2% and 161.8% fibo at 1.2831 and 1.2732 respectively. However, the key correctional targets will be 23.6%, 38.2%, and 50.0 fibo at 1.2853, 1.2957, and 1.3039 respectively.
