Brent
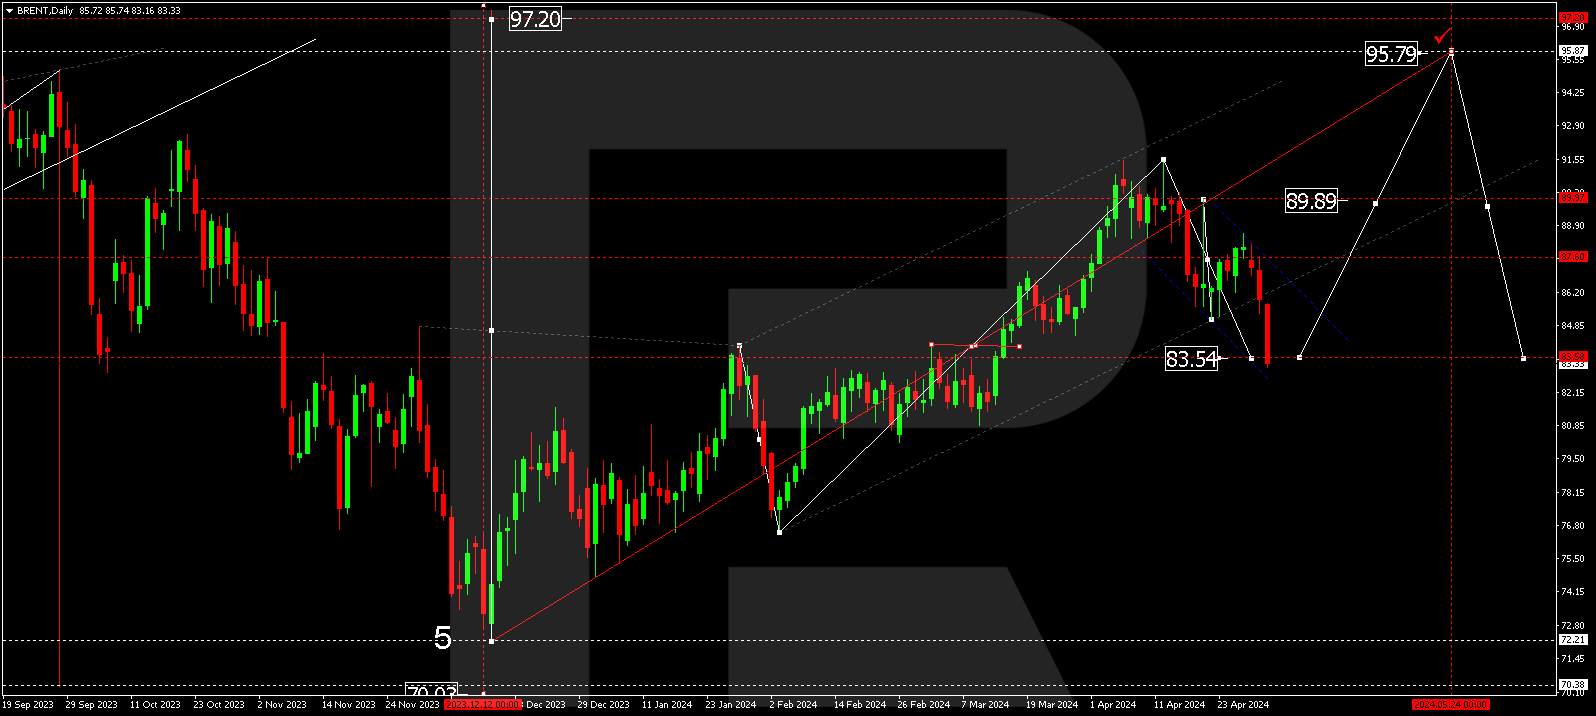
РAs we can see in the daily chart, Brent is falling and this descending movement may be both a pullback and a new “bearish” phase. The chart also allows to evaluate this decline for the long-term. The downside targets may be 23.6%, 38.2%, and 50.0% fibo at 69.90, 59.53, and 51.20 respectively. The key resistance here is the high at 86.63.


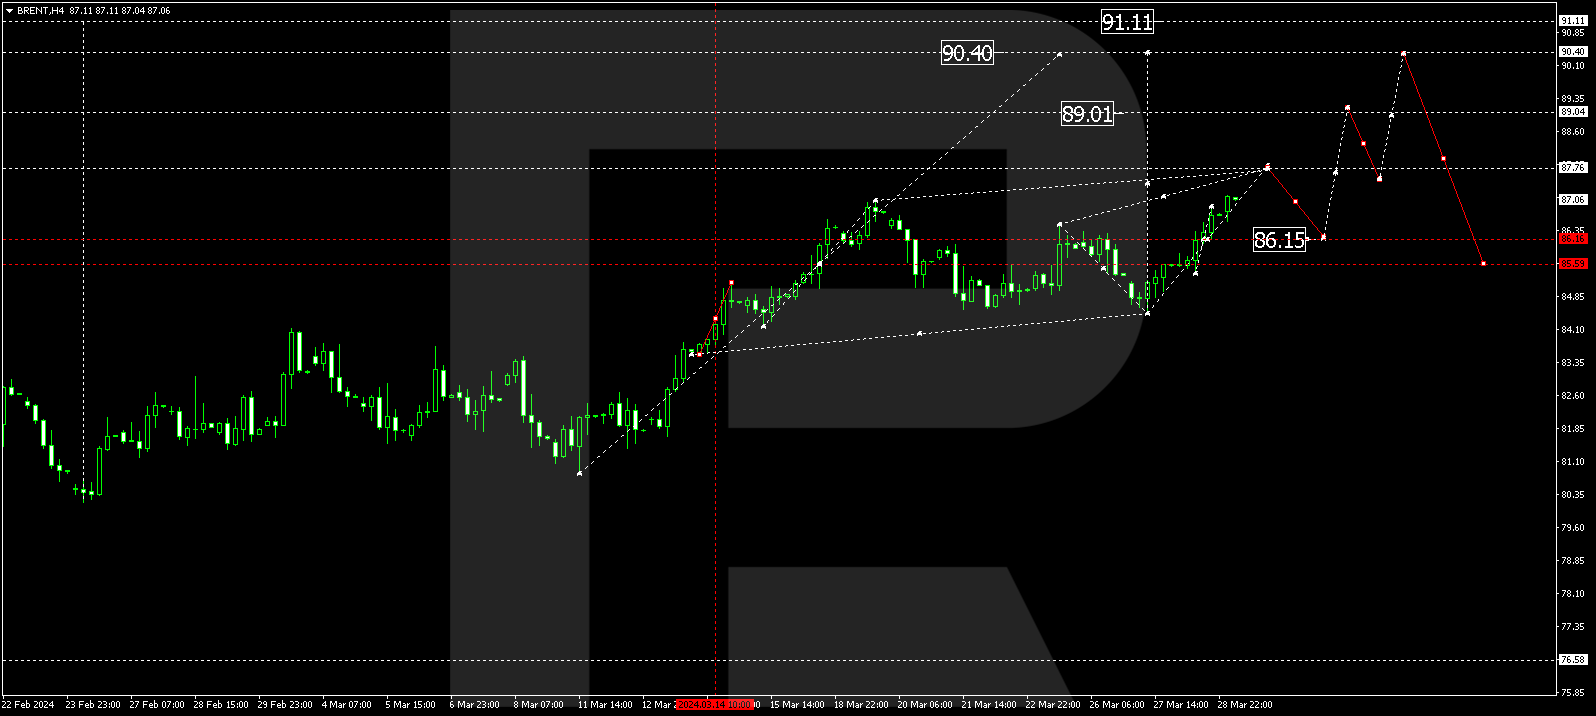
The H4 chart shows a more detailed structure of the current descending correction. The previous rising wave was stopped inside the post-correctional extension area between 138.2% and 161.8% fibo by divergence on MACD. By now, the descending correction has already broken 23.6% fibo and is currently moving towards 38.2% fibo at 78.39. The next important downside targets may be 61.8% and 76.0% fibo at 75.83 and 73.29 respectively.


Dow Jones
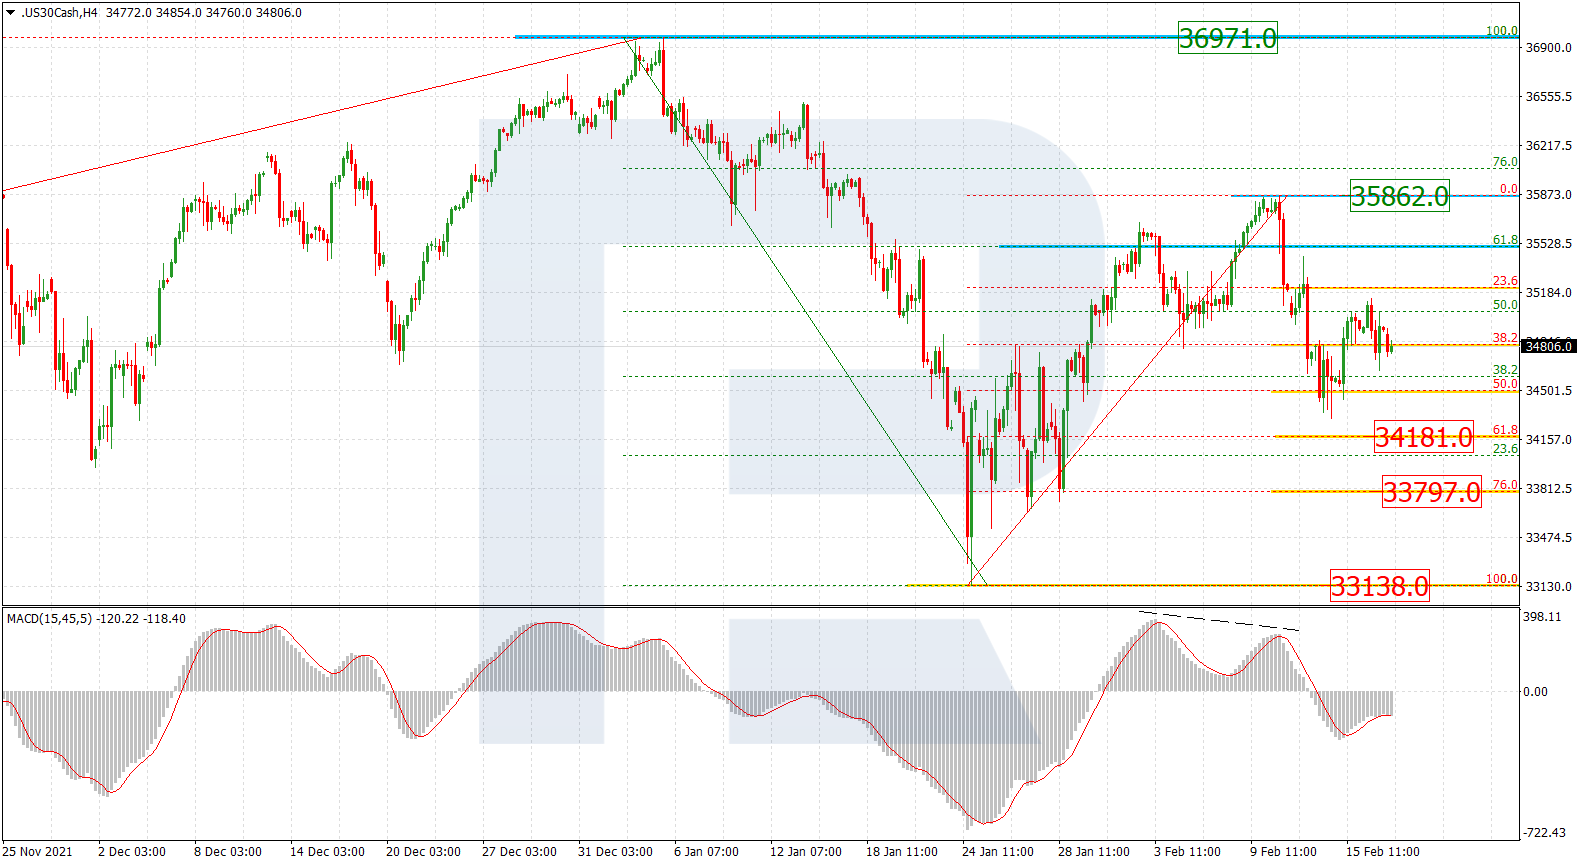
As we can see in the H4 chart, the asset is starting a new decline after testing and entering the post-correctional extension area between 138.2% and 161.8% fibo at 36434.0 and 36933.0 respectively. Another signal in favour of this decline was divergence on MACD. At the moment, the asset is testing 23.6% fibo at 35850.5, a breakout of which may lead to a further downtrend towards 38.2%, 50.0%, 61.8%, and 76.0% fibo at 35403.0, 35040.0, 34680.0, and 34254.0 respectively. the key downside target and the support is the fractal low at 33517.0.


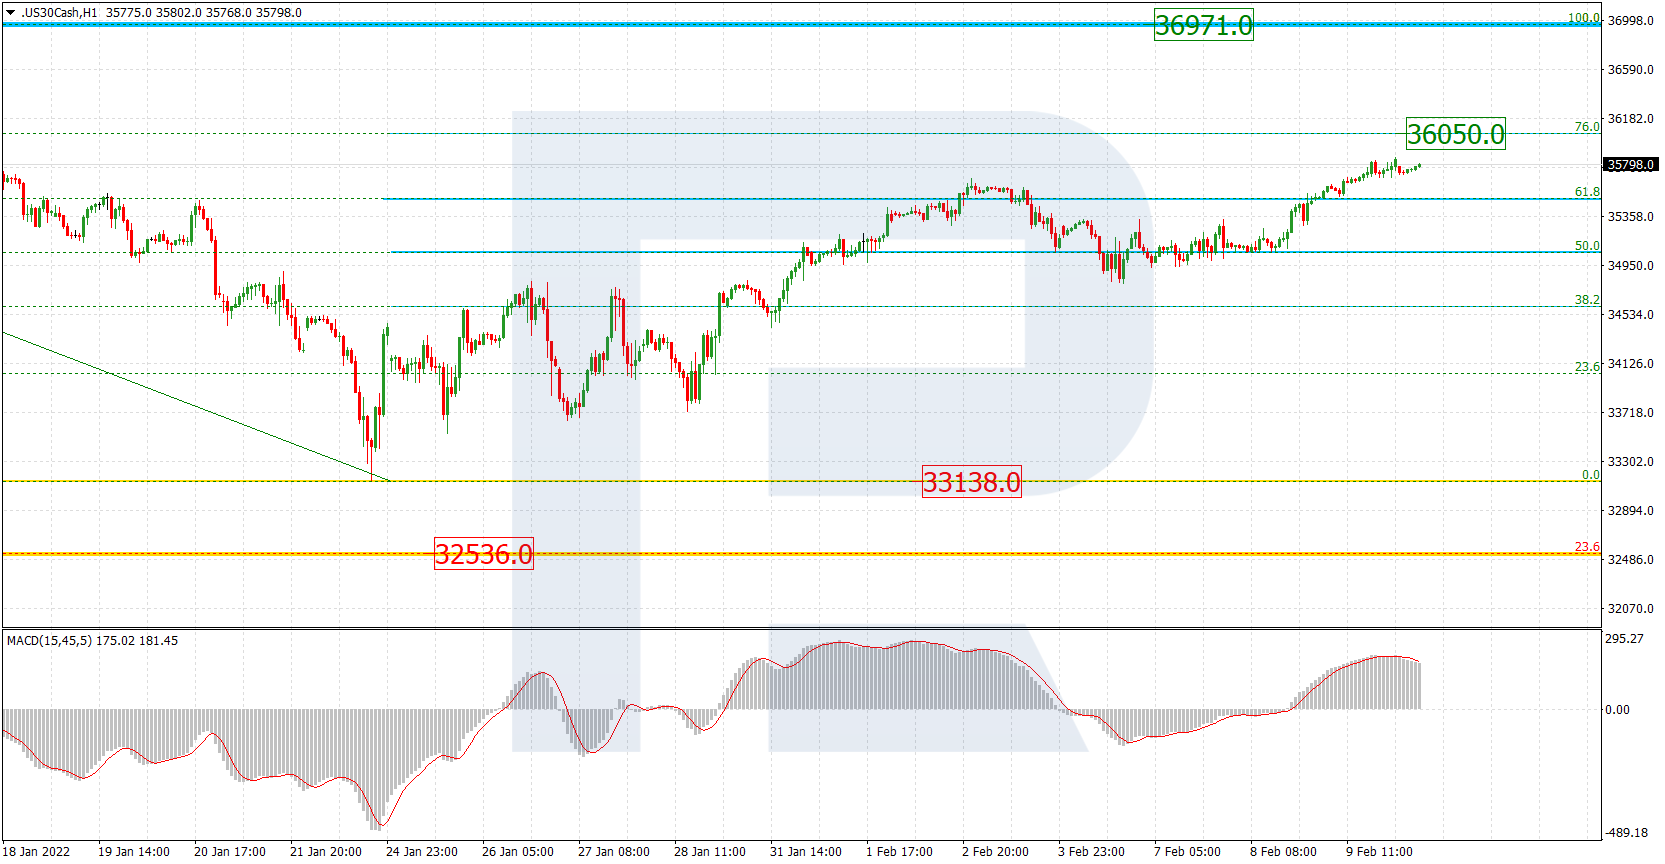
The H1 chart shows divergence on MACD while the price is approaching 23.6% fibo at 35850.5. In this case, the asset may soon start a new rising impulse to reach the high at 36570.0.

