AUDUSD, “Australian Dollar vs US Dollar”
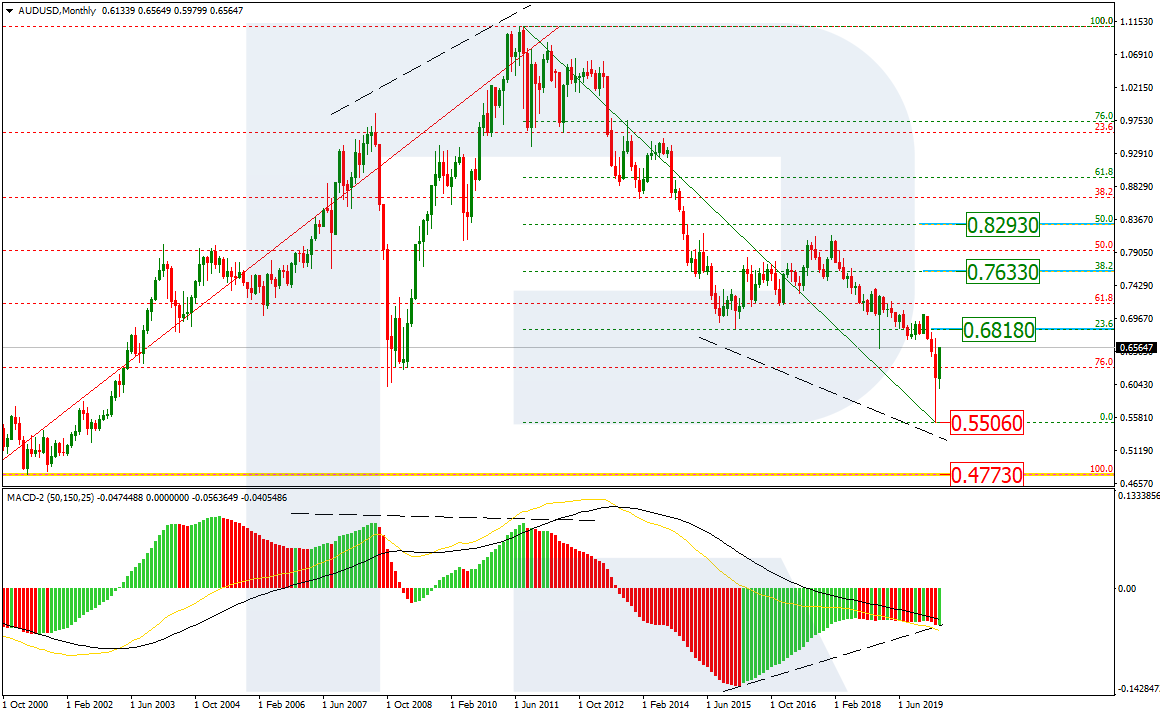
It’s better to analyze the current market situation using the monthly chart. As we can see, AUDUSD has broken 76.0% fibo and is currently moving towards the long-term fractal support at 0.7477. After reaching this level, the pair may rebound and start a new long-term bullish phase. In this case, the resistance is 61.8% fibo at 0.7180.

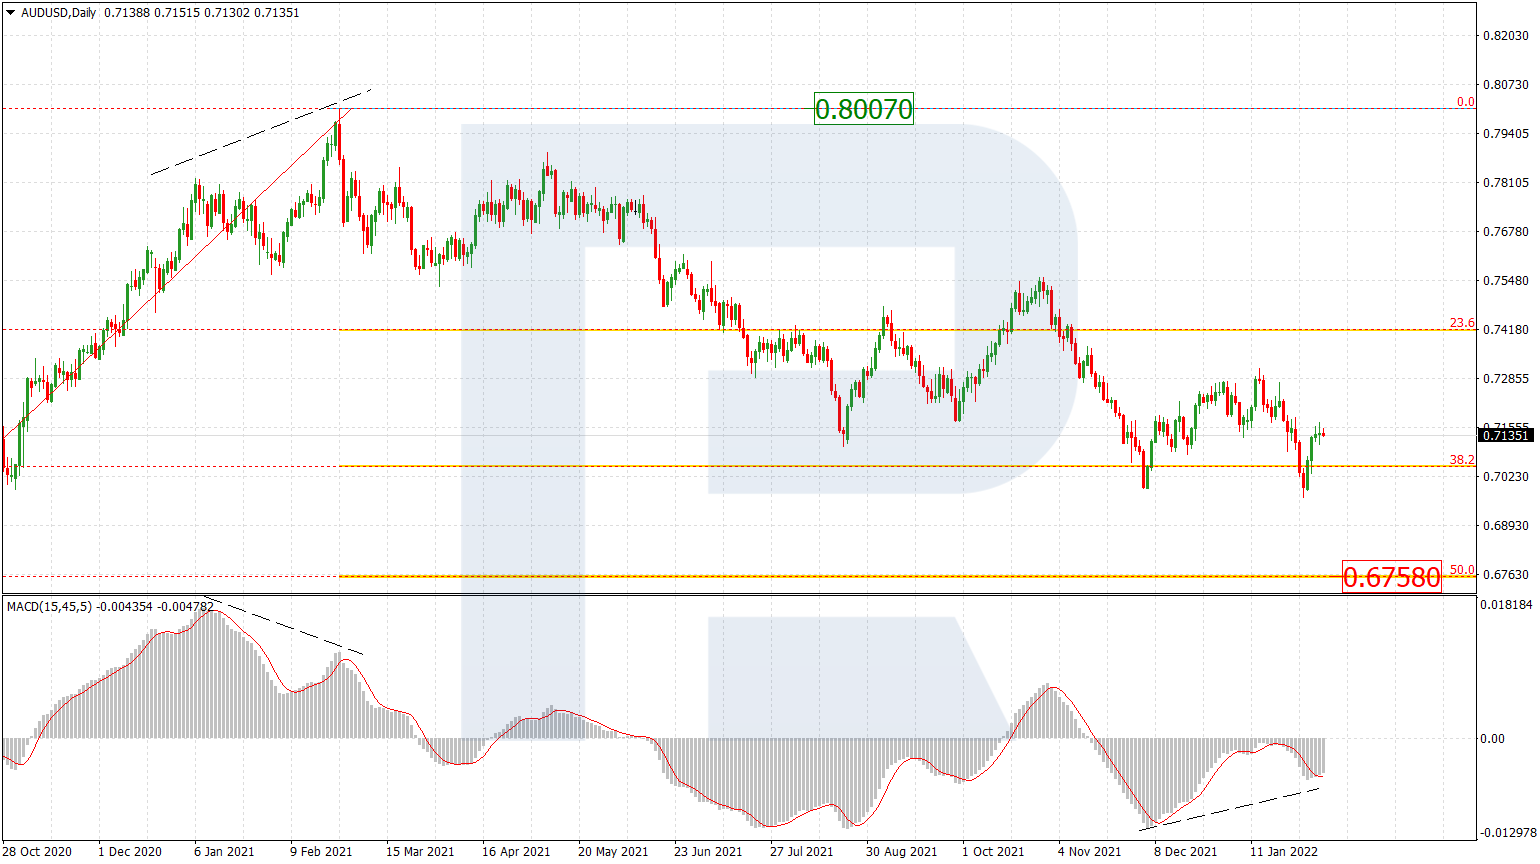
In the daily chart, AUDUSD is moving towards the post-correctional 261.8% fibo at 0.5335. After rebounding from this level, the instrument may start a new mid-term correction.
USDCAD, “US Dollar vs Canadian Dollar”
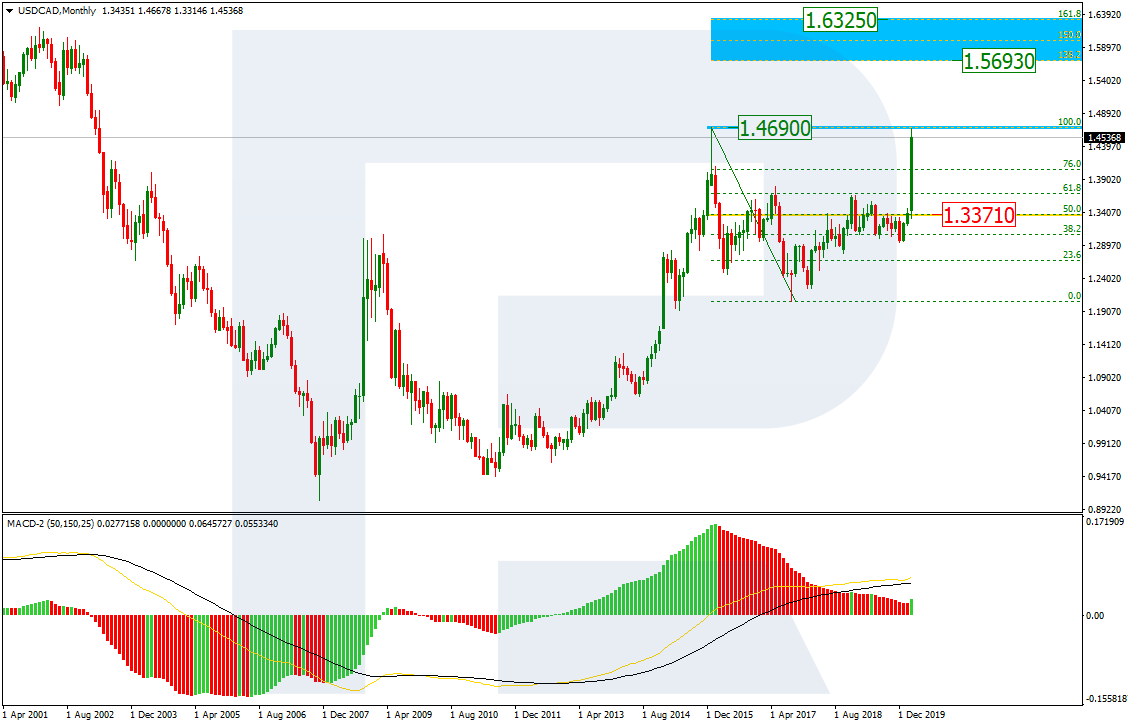
As we can see in the monthly chart, USDCAD is forming a quick rising impulse, which is heading towards the long-term high at 1.4690. If the price breaks this level, it may continue growing to reach the post-correctional extension area between 138.2% and 161.8% fibo at 1.5693 and 1.6325 respectively. The current support is at 1.3371.
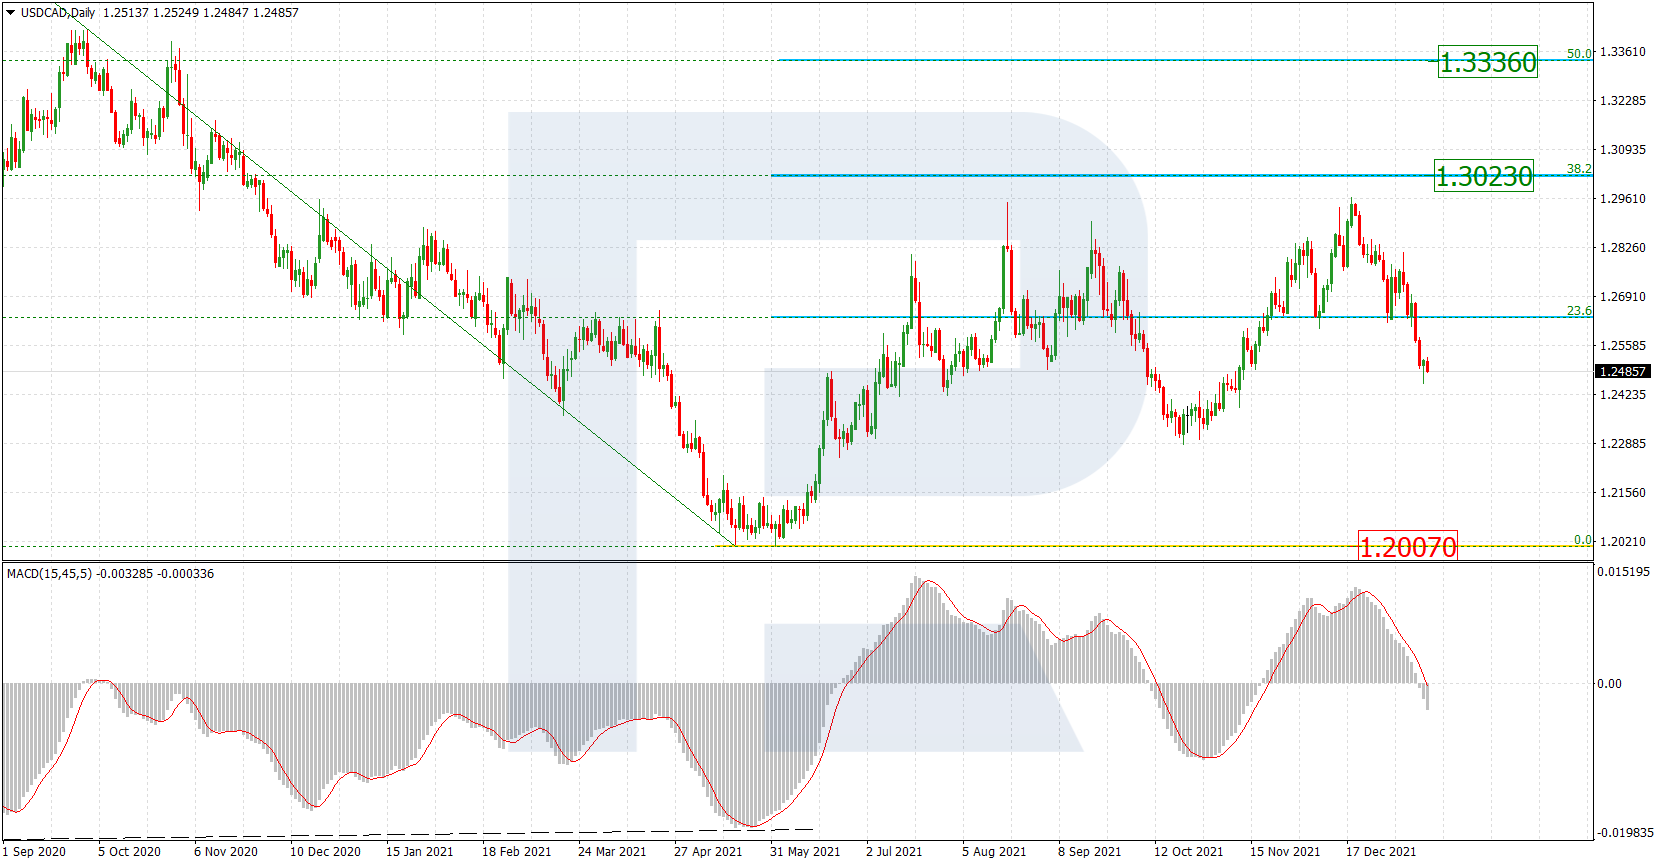
In the daily chart, the pair is testing the high and may later start a new pullback; the targets are 23.6%, 38.2%, and 50.0% fibo at 1.4260, 1.4010, and 1.3811 respectively. The resistance is at 1.4668