GBP/USD
The H4-chart of GBP/USD suggests a reversal pattern - divergence. The downward move has already formed the previous ascending impulse 23.6% by Fibo. The levels 38,2%, 50,0% and 61,8% can serve as the next targets for the correction while the nearest target is 1.2918 mark (38.2% level). In case the current local high 1.3126 is broken through, the pair can rise towards 1.3220 which corresponds to 138.2% of the previous correction' elongation.

The divergence that has been formed on the H1-chart suggested a correction. The pair has corrected then by 38.2% (1,3000 mark). The 50.0% Fibo level (1.2967 mark) can become the next target for the correction move.

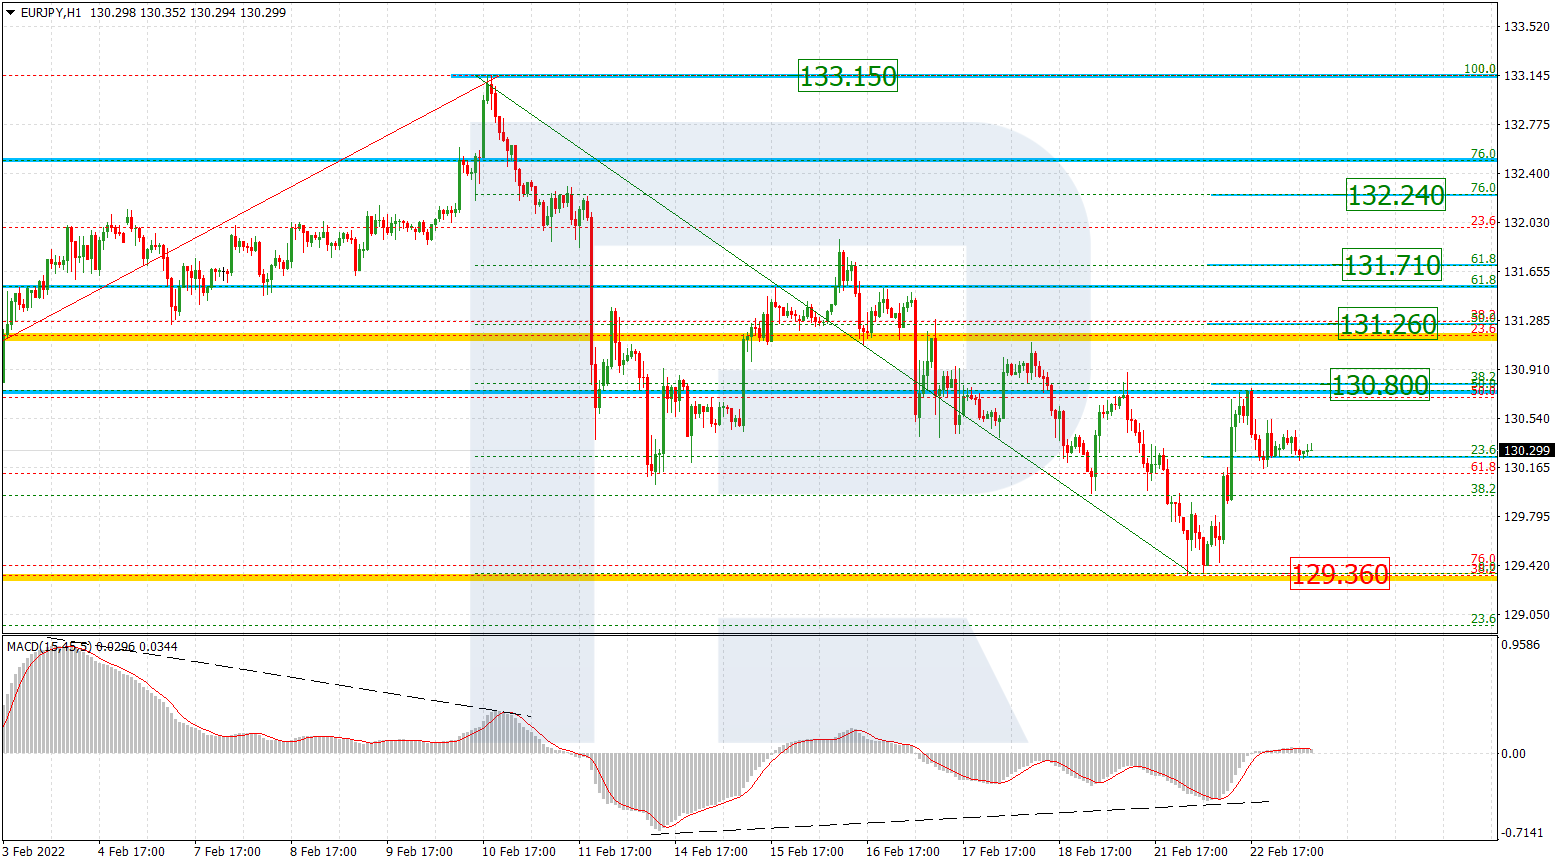
EUR/JPY
Looking at the H4 EUR/JPY,chart we can see the start of a correction downward move which was predicted by the divergence earlier. The pair has corrected by 23.6% and the Fibo levels 38.2% (127.55) and 50.0% (126.57) may serve as the next target for this correction. The resistance level stands at the local high.

The H1 EUR/JPY chart confirms the view of the senior timeframe. The pair has started a consolidation range.